
The USDJPY has fallen below trend line support connecting recent highs. That level comes at the 107.63 this week. The price is trading in the middle of the trading range for the day of 107.05 and 107.56. Looking at the weekly chart below the next major support comes at the 105.576 level. This level represents the 61.8% retracement from the move down from the 2007 high to the 2011 low. The high price from the week of December 29, 2013 was not far from this level at 105.43. If the topside trend line provides a ceiling for trading this week we could head down and test this level.
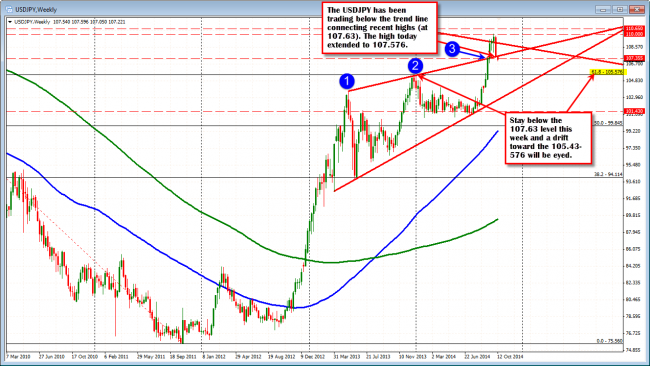
The USDJPY is staying below the topside trend line at the 107.63. Level to eye this week.
Looking at the hourly chart, the pair fell below bottom trend line support on the hourly chart in the Asian session, but extended back above during the London morning session. The price is back below the line at the 107.32 and this level will be close resistance in a quiet trading day. The low for the day at 107.05 and then the low from back on September 16th at 106.79 will be the net short term targets.
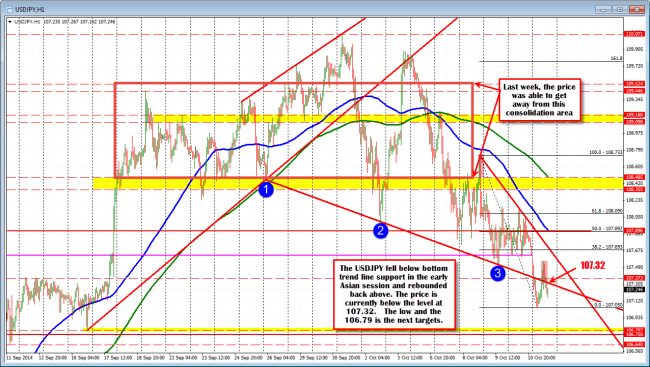
USDJPY down but off the lows
With the US partially celebrating the Columbus Day holiday (stock markets are open), the activity should be light. Don’t expect much and understand, trusting the moves is another question.

