
The AUDUSD has been trading in a volatile up and down fashion in the month of October. Over that time the price has had a series of lows that took out the January 2014 low price at 0.8659. Below are the lows we have made in October near that level:
- The low from October 1 came in at 0.86626.
- The low from October 3rd made new year lows at 0.8642.
- The low from October 6th came in at 0.86515
- The low from yesterday (October 13) came in at 0.86514
The low from January has been a speed bump for the AUDUSD’s decline.
That is a lot of lows in the 0.8642 to 0.8662 area, and overall, there have been three looks below the January low with little momentum on each break. Clearly, the market has been taking a breather after the sharp move low in September.
The most recent test of the January low came yesterday and the failure to extend lower sent the price higher (China trade data helped the pair yesterday).
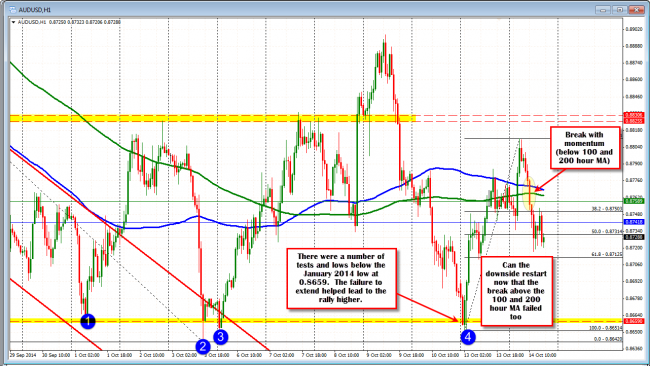
AUDUSD has it’s share of ups (off of the January 2014 low at 0.8659) and downs (back below the 100 and 200 hour MAs).
In today’s trade, the price extended further – rising above the 100 hour MA (blue line) – and reached a peak at 0.88114. From there, the correction lower started. That move first tested and held the 100 hour MA, but then fell – with momentum – below it (see chart above). The rally was over. The buyers turned to sellers.
The last 6 or 7 hours has seen the price consolidate, but it remains below both the 200 hour MA (green line) and the 100 hour MA (blue line). This is the line in the sand for the bears now.
Looking at the 5 minute chart, the correction off the lows today, came up to the 38.2% of the move down and near the 100 bar MA. So the sellers remain in control – at least from the move down today. Keep an eye on the 100 bar MA now for intraday momentum clues. Stay below and the bears are firmly in control. Move above, and there may be some further correction.
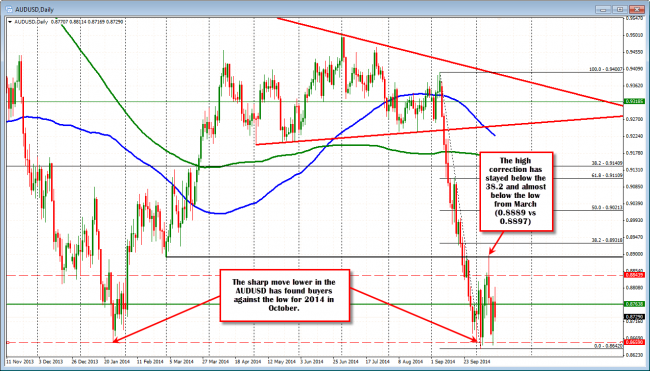
Overall, for the pair, I am more bearish. The largest price correction for the pair extended just above the low from March but stayed below the 38.2% of the September fall. Today’s move broke above the 100 hour MA and should have stayed above that level. It did not. So that failure and the high move has me thinking that sellers are more in control and want to stay in control. If so, at some point there should be a move below the low. Risk? I don’t want to see a move above the 100 and 200 hour MAs. That is the line in the sand.
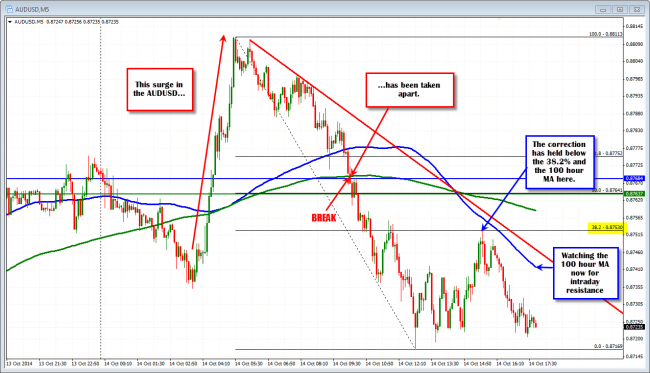
The AUDUSD 5 minute chart is showing weakness.

