
Remember our GBP/USD wedge from earlier today, and where the next 20 pips were coming from?
The before
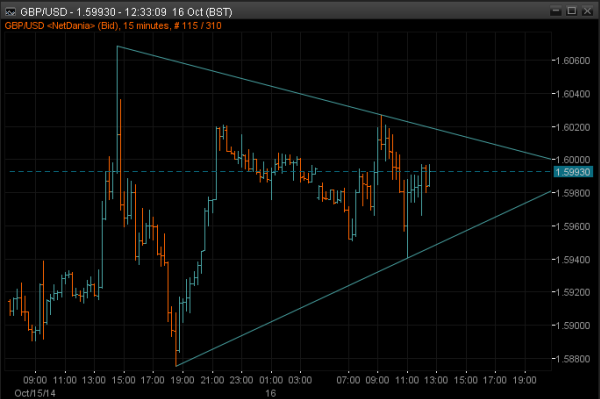
GBPUSD 15m chart No1
The after
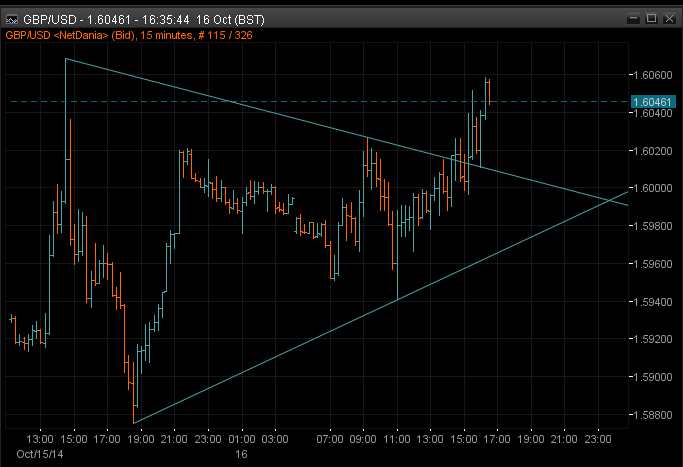
GBPUSD 15m chart No2
Selling the first time along the top could have netted you around 28 pips (call it 20 with spreads). You could have had probably two more trades netting around another 15-20 pips before it broke. The higher lows were the clue that the market was looking to break up.
Trading the break of both the wedge and the 1.6027 morning high would have got you at least another 15/20. Trading against the broken wedge was a 45/50 pip winner. Let’s say you were short when it broke with a stop as I suggested just above 1.6027, maybe at 1.6032/35. That would have cost you maybe 25 pips. Netted off that’s around 70 pips profit (at the low end).
Seems so easy right? It isn’t. It looks damn easy when you see the chart after the event but therein lies the key. You won’t be making 100’s of pips from one trade off of a 15 minute chart but if you pick your entry points, and know your loss and profit points, and let the market show you where they are, then it doesn’t matter what chart you look at as the same principle applies every time. Use the levels, manage the trades and your expectations. You don’t need to “guess” where the market will go, it’s out of your hands. Will they all be winners? Not a chance but you are limiting your risk and giving yourself a better chance than mucking around in the middle of something that can go either way.
The only person who can make trading simple is you.

