
The S&P is up strongly in trading today, but the damage done this week still has some hurdles to “take back”.
The key level for the S&P to get back above is the 200 day MA (yellow line in the chart below). That moving average comes in at the 1906.03 level in trading today.
The plunge below this moving average this week was the first break below since November 2012. Key breaks like that need to be taken back to give the “market” more confidence
Before that level, the 38.2% of the move down from the high comes in at the 1896.53 (see chart).
Until the price can move back above these two technical levels, the correction is nice, the dip buyers are happy, but nothing is really confirmed that a bottom is truly in place. Be aware.
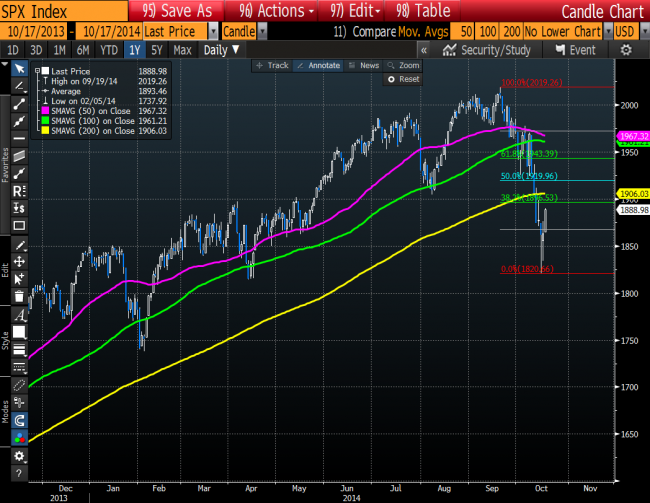
S& P looking good but still has the 200 day MA to contend with on the topside.

