
Last week, the price of Gold started a corrective move (on Tuesday and into Wednesday) and the correction lower sent the price below the 100 hour MA (blue line – see chart below. Also see post from last week Gold: Can we go higher?).
As we know, on Wednesday, there was weaker US economic data (led by retail sales), the Ebola scare was in full fear mode, and the stock market sold off by as much at 460 points. The price of gold soared back above the 100 hour MA (blue line) on a flight into safety bid. The buyers were back in control and the high on Wednesday came in at 1249.59. Since then the price has stalled and corrected – until today.
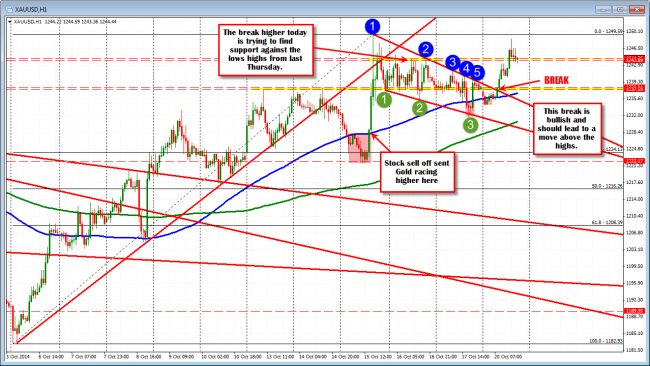
Gold broke on the hourly chart. Trying to stay above 1243.89 high closing hourly bar.
Today, we have seen a break above topside trend line resistance (blue numbers), and that has helped contribute to a move higher. Bulls back in control.
Over the last few hours we are seeing a retracement as the high at 1249.59 could not be broken.
The question now becomes, “Can that momentum from the buyers continue?”.
Looking at the hourly chart above, the price correction is down at a key area. The moves to the upside last week for the most part had a succession of failed breaks. On each hourly bar above 1243.89 (that was the highest hourly close price last week), the price reversed. There was a succession of lower lows. On Thursday, the last two price peaks reached 1244.20 area.
The good news for the bulls, is the rebound higher. The correction started when the market bought against the lower trend line (green circles) on Friday. The price was able to get above the 100 hour MA (blue line in chart above) and break above the topside trend line today – all are bullish developments. What I would like to see now, is the buyers remain in control on this correction.
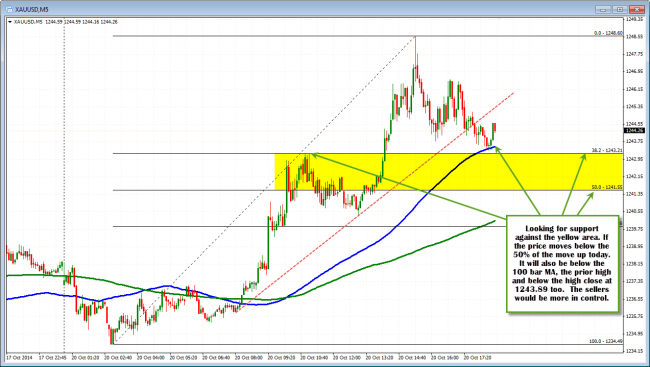
Looking at the 5 minute chart below, my risk is defined. The correction off the highs has been able to find support against the 100 bar SMA (blue line in the chart below). The 38.2%-50% of the move higher today remains in tact (between 1241.55 and 1243.21). A high from earlier today comes in at the 38.2% area (at 1243.21).
IF the price can remain above the yellow area, the buyers remain in control and a push to the highs (and through) will be eyed.
If the price fails and moves below the yellow area, I am afraid the buyers we are seeing today, will likely get discouraged (like last week) and sell out.
If the buyers can remain in control, 1252.76 (midpoint of the move down from the August high) will be the next target. Above that the 1263.93 level will be eyed (50% of the move down from July 2014 high). Test time for the bulls. Do you still love it?
Gold should stay above the yellow area if the buyers really love it.

