
The GBPUSD is lower on the day after lower than expected Retail Sales were worse than expectations. From a technical analysis perspective, the price was able to keep a lid on the Asian session rise against the 200 hour MA (green line in the chart below).
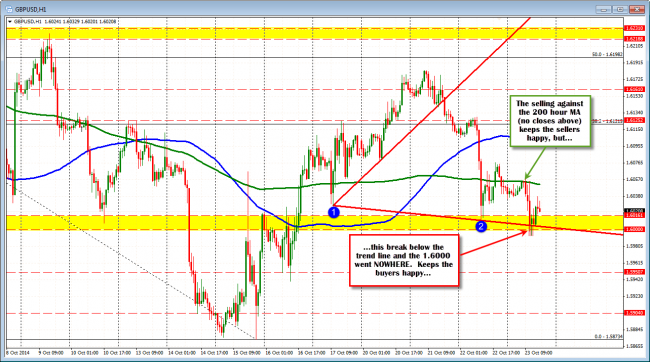
GBPUSD on the hourly showing resistance against the 200 hour MA but support near 1.6000.
The price fall was able to breach the 1.6000 level and trend line support (see hourly chart above), but the price could only get to the 1.5993 level before rebounding. There were no closes below the 1.6000 level. Disappointing break for the sellers. If you forgot, the 1.60000 level is not only a nice round number, but is also the 50% of the move up from the 2013 low to the 2014 high. The 1.6016 level is the 200 week moving average this week and the price is also back above that level now. A move below this level will be eyed as step one for the sellers if they are to push this pair lower (my hunch).
Overall, the selling above buying below, gives a bunch of mixed technical signals today:
Bullish:
- The price is above 1.6000 (no closes on hourly below that key level)
- The price is back above the 1.6016 – 200 week MA level
- The price is back above the broken trend line (failed break).
Bearish:
- The price held below the 200 hour MA (at 1.6052 now)
- The price is below the close at 1.60496
- The price is staying below the 200 bar MA (green line on the 5 minute chart)
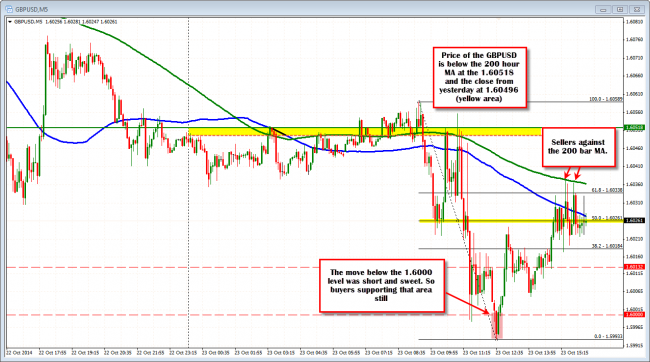
Sellers against the 200 bar MA on the 5 minute chart. Trading near midpoint of the days range.
Neutral:
- The price is trading at the days midpoint (50% at 1.6026).
The closest level to lean against is the 200 bar MA on 5 minute chart. The price tested that twice and held twice. The price is lower and just below the 50%. As a result, my bias right now is down off the more dovish BOE, and the bearish technicals, but it is not a strong sell. The trade? Nothing now. Wait a little longer. See if there is a better sell a bit higher – closer to the 200 hour MA so risk is minimal. If the price can hold below the 200 bar MA, I can see a potential move back toward the 1.6000 key support, with the next break expecting not to fail. If it goes above get out.
FOREX EDUCATION: Look for the clues from price action. Line up the bullish and bearish clues. If there is a winner, go for it. If there is no winner, it is ok to do nothing and wait for a better level. The extra pips on the entry, will give more confidence and with it comes less fear.

