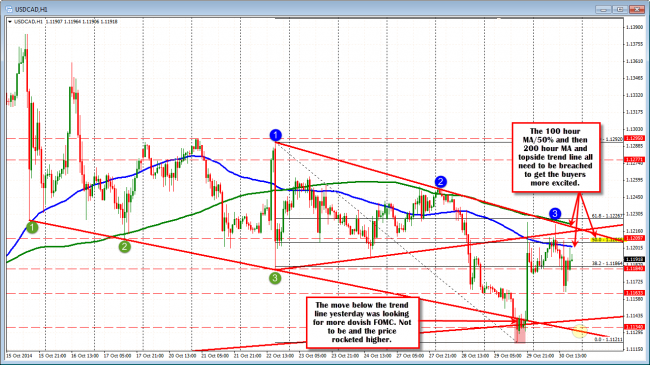
The USDCAD sits below some topside resistance but is not showing signs of a selling commitment after the harsh “in your face” rally after the FOMC decision yesterday.
Tomorrow, the Canada GDP will be releases for August and for YoY. The estimate is for 0.0% growth in August and 2.3% for the YoY down from 2.5% in July. The low for 2014 has been 2.0% in March and April. The high water mark was 3.1% in June 2013.
What else can be said from a fundamental perspective for this pair?
Adam wrote a great piece on Canada’s failure to take advantage of natural resources (see: “Three reasons why every Canadian dollar bounce is doomed to fail“). He argues for a lower CAD over time as result.
So what is the price action and technicals currently saying?

USDCAD stays below topside resistance.
From a technical perspective the price surge off of the FOMC statement yesterday took the pair quickly toward the 200 hour MA (green line currently at the 1.1222 level) and topside trend line resistance. Those levels were tested again today in the London morning session, before chopping around on the US GDP data and post-GDP dollar selling.
The 100 hour MA (blue line at 1.1203) seems to have replaced the 200 hour MA as a level of resistance for the time being. The 50% retracement at 1.12065 is also in the area of the 100 hour MA now.
If the USDCAD is to rally (CAD sell off), getting above and staying above these levels will be needed. Get above, and the tide can turn higher. Stay below and there may be cheaper levels for the pair to target including the lower trend line at around the 1.1134 area before buyers reenter.
At the current level, I cannot say I am more bullish or bearish. I would rather wait it out and look for a move back above the 100 hour MA and 50%. Then look for follow through momentum buying. Alternatively, waiting out a test of the lower trend line near the lows from yesterday, might be the next best alternative. Doing something here does not seem to offer much.
Patience.


