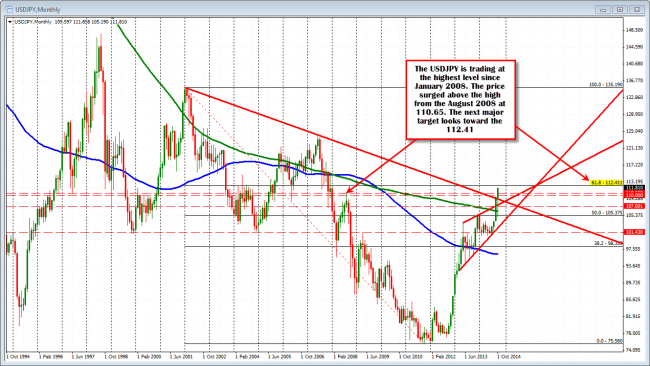
The surprise BOJ stimulus has sent the USDJPY racing to the upside. Drive for 110.00 is an understatement. How about a drive for 112.41.
That 112.41 level is the next longer term target which corresponds to the 61.8% of the move down from the century high in January 2002, to the century low in October 2011. The move higher on the longer term chart below, has seen the price move above the August 2008 high at the 110.65 (was a target above the 110.00 area). The price also surged above the trend line connecting the 2002 high to the 2007 high in the process (see chart below). The range for the day is about 272 pips so far.
Congratulations to all traders who benefited from the surprise move!

USDJPY monthly chart targets 112.41
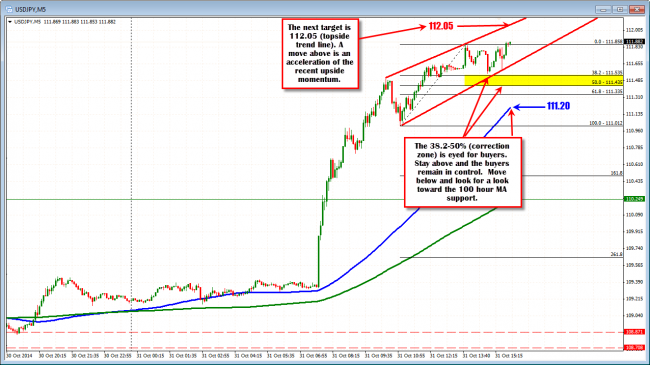
Looking at the intraday activity, the surge higher has seen a slowing of the momentum, but the price continues to move higher and be supported on dips. The worse than expected US Spending data led to a small dip, but the 38.2% of the last leg higher is holding at 111.535.
When the price trends higher – like it has today – and the range is large (around 272 pips) defining support levels becomes hard. What I do is break the trend down and look for corrections of the legs higher. IF the price can stay above the 38.2-50% of the last leg higher (I call it the Correction Zone), it shows the bulls are in control. Traders looking to get in, can use this area as a risk defining level (or entry area). Holding it on the last dips, has me looking for the trend to continue with a break of the high targeted next.
In the chart below, the last leg higher started at the 111.012 level. The 38.2% of that move comes in at 111.535. The 50% comes in at 111.435. Stay above the 111.435-535 and the buyers remain in control/the sellers continue to feel the pressure. The dip on the weaker US data held the 38.2%. Buyers remain in control.
Is there a target other than the old high?
Looking at the 5 minute chart again, connect the recent highs and the the 112. 05 becomes a topside target. If the price moves above that level, it says to me the momentum is accelerating. That should lead to another surge higher (but also should be eyed for failures too). If the price moves above and fails, I will tend to look for a further correction/slowing of the move higher. Reset the Fibonacci Retracement and look for the correction zone to hold for the intraday support levels once again.

The USDJPY is holding the 38.2-50% of the the last leg higher. The 112.05 is the next upside target.
USD/JPY, technical analysis, yen


