
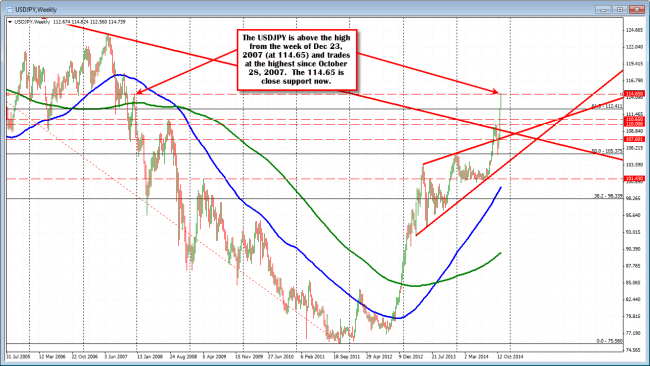
The USDJPY is moving above the 114.65 level which is the high from the week of December 23, 2007 (see chart below). That makes the pair’s price at the highest level since the week of October 28, 2007. The high has extended up to the 114. 824 . The bulls remain in control.
The 5 minute chart shows the importance of the 114.65 level today.
How can you trade this pair from here?
First off, the bulls are in control. The price is trending higher. So trade shorts with extreme caution (i.e., define risk). It may seem high and overbought, but trends are fast and directional and go farther than you think. So keep that in mind.
Now having said that, the low to high trading range is 146 pips for the day. The average is 109 pips over the last 22 trading days. So the day is extended to the upside. That may limit the upside, but once again it can go higher. So be cautious.
What else do we know?
The price moved above the December 23, 2007 week high at the 114.65 (bullish) twice now. What happened on that move above the level. To see it more clearly, you need to look at the 5 minute chart. The first push above, saw the subsequently move to a high of 114.823 and then the price fell back below that 114.65 level (see 5 minute chart below).
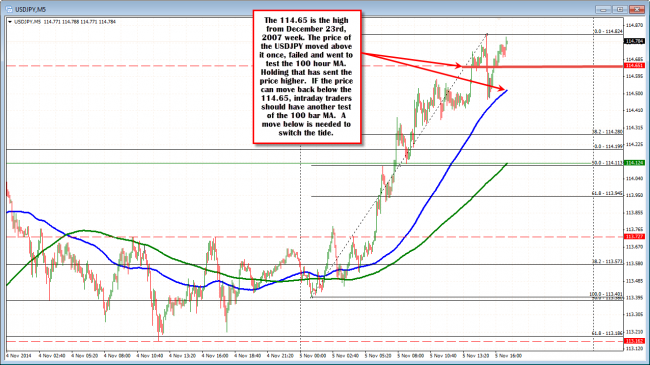
The fall took the price toward the 100 bar MA on the 5 minute chart (blue line) where buyers resurfaced (support holds). The move back above the 114.65 has seen that level become reestablished as a potential floor. If that level is broken AND the 100 bar MA below is also broken, traders may be taking profit/the shorts are taking back some control. I would look for a further rotation lower.
If those two levels cannot be broken today, the buyers remain in control. Longs can stay with their positions. The activity is two way around the 114.65 level. Which way is the see-saw going take from here? The good news is risk can be defined and limited.

