
The EURUSD technical levels to eye through the ECB decision
The EURUSD has been gearing up for the ECB statement and Mario Draghi press conference today. It got more interesting with the reports of unhappiness with the way Draghi has been conducting himself among his fellow ECB members. However, all seems to be ok (at least according to sources).
As we all know, the market can take the price places we never thought on a word or two (or more) and the interpretation of what is said or implied. The ECB has little more they can do that has not already been done with the exception of sovereign debt buying. So the focus will be on the words and then how the market interprets those words. From my perspective, he should be more dovish in his remarks, but that does not mean he will or the market will react in the appropriate fashion.
What are the technical levels to eye through the report?
EURUSD steps higher and lower.
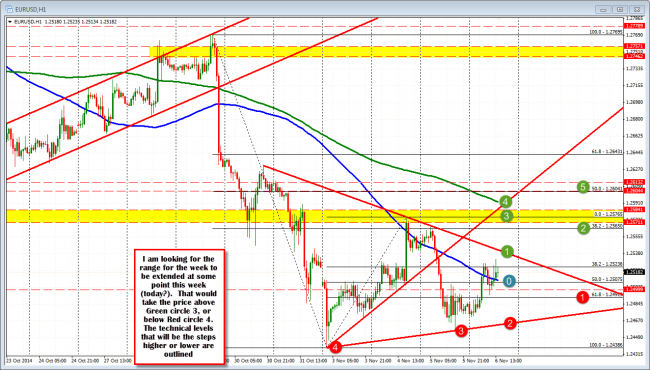
The EURUSD is sitting in a tidy 137 pip trading range for the week. That is low by recent (i.e. market started to pick up steam in August/September) standards (just eyeballing the median is around 190 pips). So there is room for an extension before the week is out. So getting above the 1.2576 high, or below the 1.24386 is in my mind. We currently are trading at 1.2516. The mid point of the range this week is 1.25075. So the market is within 9 pips of being at the middle of the range. There is room to roam. The 100 hour MA has conveniently plopped itself at the 1.2510 level . So 1.2507-10 is my line in the sand for bullish or bearish after more details are known.
Other then the idea that we will extend the range at some point today/this week, what are there other interim levels to focus on for bullish or bearish clues?
On the downside:
- 1.2491- The 61.8% of the range this week.
- 1.2462 – Trend line on the hourly chart
- 1.2456 – Low yesterday
- 1.24386 – Low for the week.
These are my most obvious steps lower. Traders can follow them down and use them to manage risk.
A move below the 1.24386 will look toward the 1.2381-88 area(this was a series of highs going back to July/August 2012). A move to this area would be about a 145 -150 pip trading range for the day. The average range for a day (over the last 22 trading days) is around 110 pips so this would be pushing a limit (does not mean the end but it would be a good day). If the price were to head down toward this target, the range for the week would be around 187 pips. That would represent a more normal weeks range from the recent history.
On the topside:
- 1.2542 – Topside trend line on the hourly chart
- 1.2565 – 38.2% of the move down from last week’s high
- 12571-85 – A series of lows and highs on the hourly chart going back to Sept 30-Oct 7. Also the high for the week at 1.25711
- 1.2593 – 200 hour MA (green line in the chart)
- 1.2604/13 – 50% retracement and low from October 23rd. I said at the beginning of the week, a move above this level and there is something else going on that I don’t see. That thing I would not see is a more hawkish (?) ECB or perhaps a resignation of Draghi.
If the price were to get to 1.2613, it would imply a range for the day of about 143 pips. That too would be a “good day” given the average trading range of 110 pips currently (for 22 days). If the price were to get above the 1.2613, a move toward the 1.2643 would be the next target (61.8% of the move down from October 29th high). That would get a 204 pip range for the week.
Let’s see what he/they have to say and more importantly, what the market is willing to do with the comments.

