
The market has gone all moody on the pound as we slip down towards 1.5800. The low so far at 1.5813 has seen a light bounce to 1.5837 but we’re back now at 1.5815.
The low last week came in at 1.5788and it’s a level to watch if 1.5800 goes.
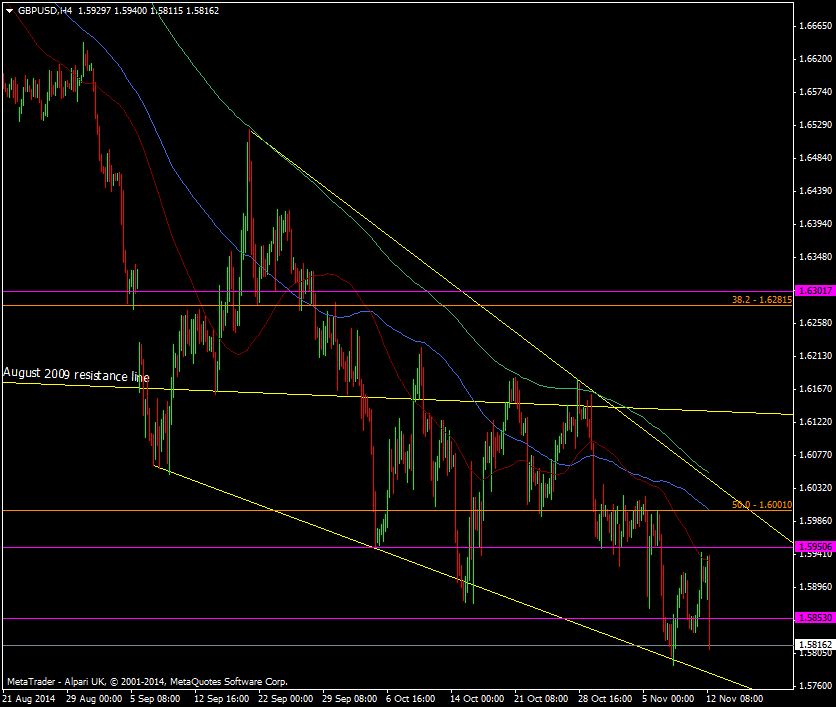
GBP/USD H4 chart 12 11 2014
Further out the 61.8 fib of the 2013 move from 1.4812 is at 1.5720 and that could mark an important point in the scope of the fall from the 1.70’s.
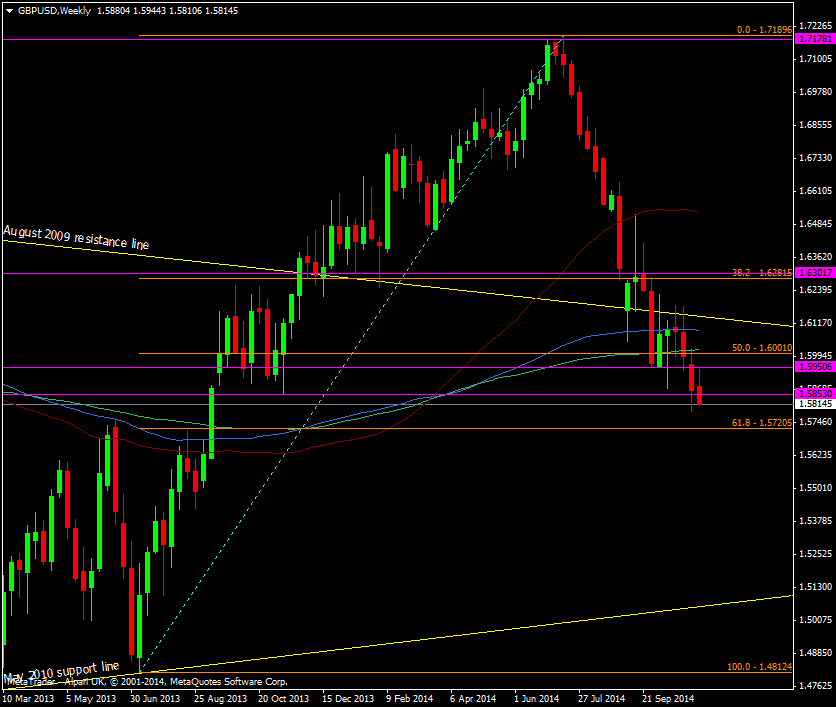
GBP/USD Weekly chart 12 11 2014
There’s a lot of people with an eye on 1.5700 so it’s likely to be a big level, if we go there.
Intraday 1.5840/50, 1.5880, 1.5890, 1.5940 are going to be the resistance levels to watch on a move back up.

