
The GBPUSD has been moving up and down over the last 7 trading days – with no discernible trend. Today their is a more bullish bias.
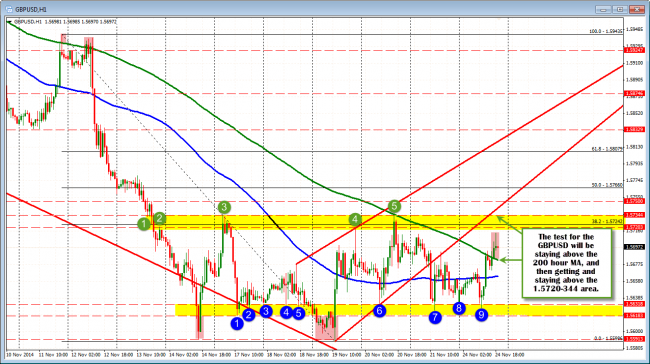
The test for the GBPUSD will be staying above the 200 hour MA and gettitng above the 1.5720-3433 area.
- The pair at the low could not move below or stay below the lows from Thursday and Friday. Looking at the lows from the hourly chart, the buyers over the last 7 trading days have been in the 1.5618-318 area. There were two looks below that area but momentum on the first set the level (see red areas). The second move lower look out the low by 3 or so pips only to fail and quickly move higher. Today the low reached 1.56275 – in the yellow area – and bounced once again
- The price moved above the 200 hour MA (green line in the chart above) at the 1.5682 currently. Last week, the price tested this MA and found sellers. The last close above the 200 hour MA was on November 12th and that break was brief, had no momentum and ultimately failed (see chart above). Will this break fail? That will be the key going forward
Is the break of the 200 hour MA signal the end of the bearish move in the GBPUSD? I am not convinced yet.
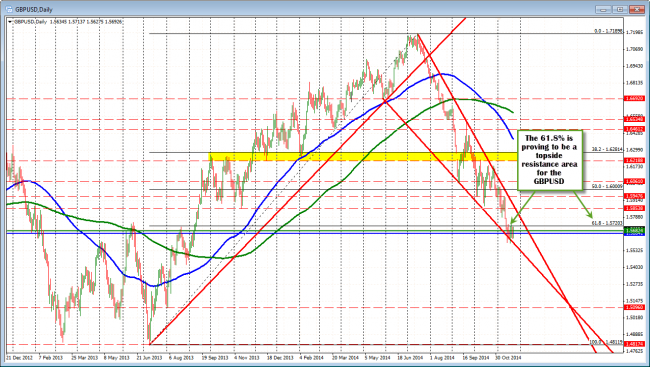
The 1.5720 is a topside resistance area for the GBPUSD
Looking at the daily chart, the 1.5720 level is the 61.8% of the move up from the July 2013 low to the Jul;y 2014 high. Since moving and closing below that level, there has been two days when the price moved above the level, but there have been no closes above the level. In fact off the hourly chart there have been 4 hourly bar closes above the level – the highest at 1.57249. Not exactly racing ahead on the break. If we are going higher there needs to be a close (and stay above) this line in the sand.
Moreover, the 38.2% of the move down from November 11 high (on the hourly chart) comes in at 1.57242. This too is resistance that needs to be broken above to swing some momentum back higher.
Finally, the two peaks recently have reversed at the 1.57344 area.
So although there is a couple reasons to call the end of the down trend (and buyers against the 200 hour MA is a legitimate trade with low risk), I still want – and need – to see a move and close above the 1.5720-34 to give me more confidence. Failure do that and the trend from the daily chart is still the trend and that is to the downside.

