
The loonie is looking to make another break of the Sep 2011 trendline but we’ve been here before and it’s been finding it tough to plow through.
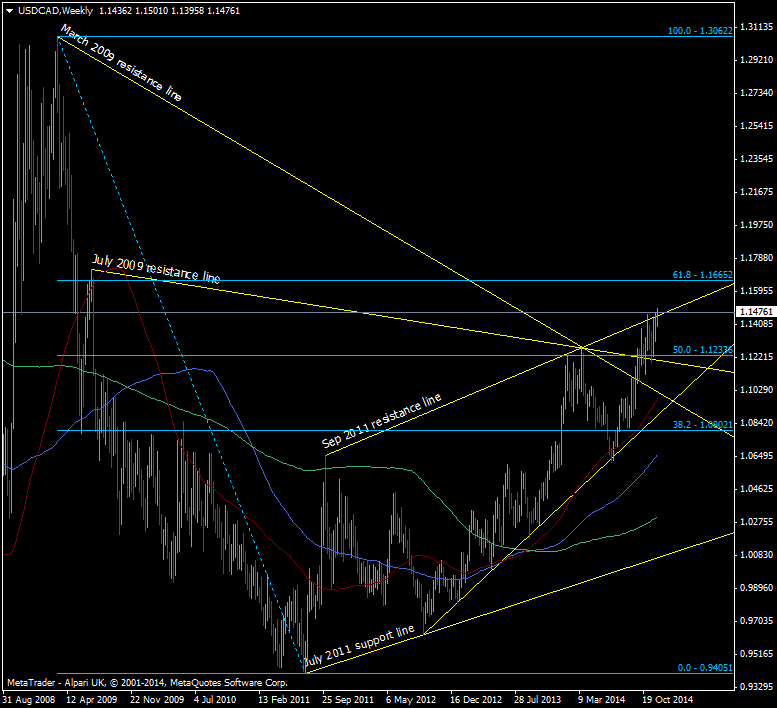
USD/CAD Weekly chart 10 12 2014
The break higher brings the 61.8 fib of the 2009/2011 into focus at 1.1665 and clearing that opens the skylight to a move to 1.20. Coming in a bit closer we can see that breaks have promised much but delivered little.
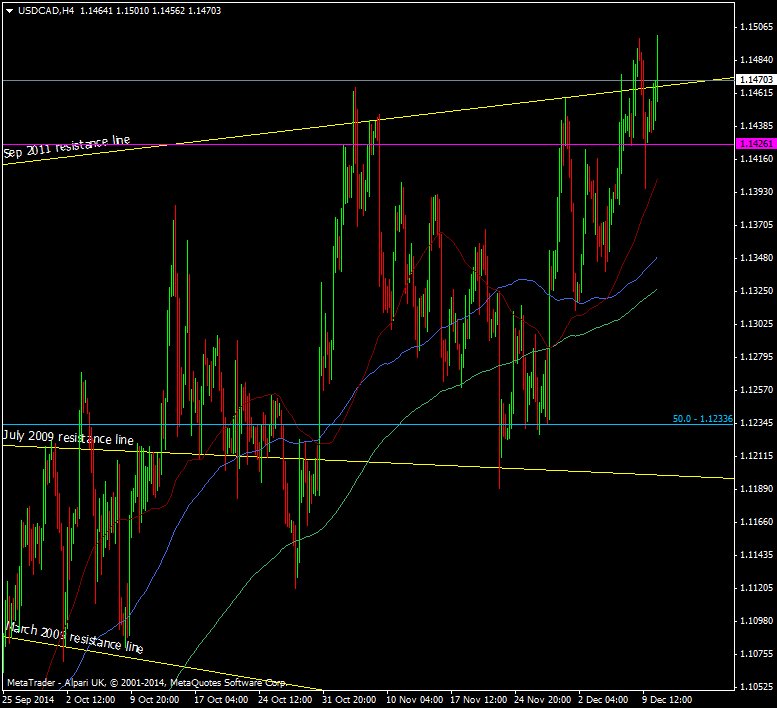
USD/CAD H4 chart 10 12 2014
Watch for the line to hold as support on a test and that may give an indication of a break. If going with the break I’d still keep a stop tight probably somewhere below the 1.1426 level or the 1.14 big figure if you want a bit of extra security.
Oil is obviously one of the biggest drivers of the currency right now and it’s flying against the general dollar sell off. WTI has touched a new low at 60.78 and there will be a lot of eyes watching the 60 level.
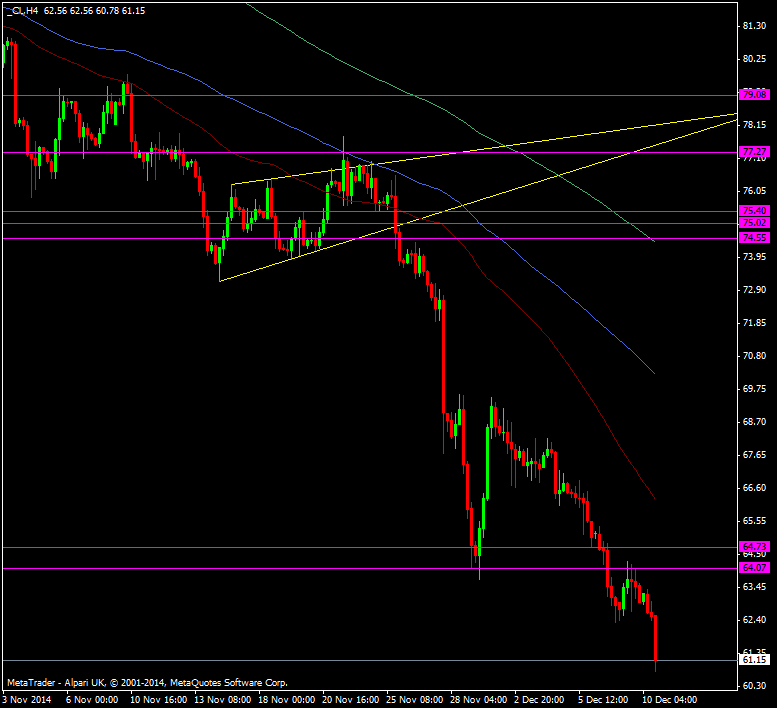
WTI crude H4 chart 10 12 2014

