
The S&P Index is down by around 17 points in trading today (currently) as traders take risk off after the move back higher yesterday.
From a technical perspective, the price fell back below a broken trend line (at 2054.80 today). If the price can stay below this level, the corrective sellers will stay in charge. The 50 and 100 day MA is at the 1998.28 and 1987.51 levels respectively today. If the bears can remain in control, this would be targets on the correction.The 38.2% of the move up from the October 15 low comes in at 1980.60. A move to the 38.2% would represent around a 4.7% decline from the high if reached. Certainly, within the realm of possibilities.
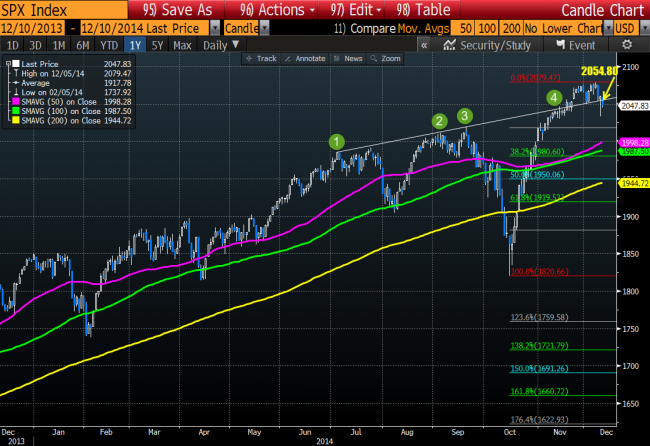
S&P Index is back below a broken trend line.
In October when the markets unraveled, the price fell not only below the 50 and 100 day MA, but also the 200 day MA (yellow line in the chart above). This was the first break below the 200 day MA going back to November 2012. So it solicited some market attention and momentum. However, as we know, the Ebola scare (which was a catalyst for the decline) abated and the price rally higher took the price up 14% from the low. Now the question is “Was it too much?”

