
The GBPUSD has been bouncing around in trading today. The BOE MPC meeting minutes were released. Summaries from Mike: The Old Lady is still stuck between a rock and a hard place and BOE MPC Minutes: Stronger wage growth needed before rate hike pretty much sums them up the best.
Looking at the charts, like the EURUSD, the pair has some fairly defined ranges that traders can use to define risk, as well as the technical bias (which is a little more bullish currently).
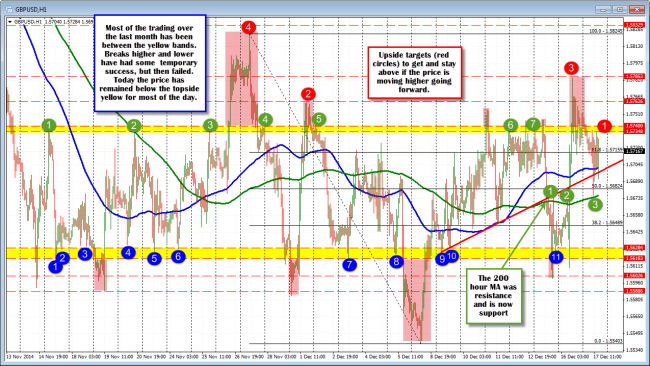
The GBPUSD Hourly chart.
Yesterday, the dollar selling on the back of the Russian turmoil and lower stock markets, sent the GBPUSD above the value area resistance level (see post from yesterday: Forex Technical Trading: GBPUSD trades above the month long value area) at 1.57348 – 40 (see top yellow area in the chart above).
Today, apart from the 1st few hours of trading (see chart above), the price has been able to stay below this resistance area/ceiling. This will remain a level that the bulls/buyers will have to get and stay above, if they want to further explore a move higher today and going forward. Above that the market will target the recent highs at 1.5763, 1.5785 (high for the week) and the high corrective price at 1.58245 (see chart above).
NOTE the 1.5725 is topside trend line on the daily chart (see chart below). This line was broken yesterday but momentum could not be sustained. Keep an eye on this level in trading today. Stay above on a break and given the narrow trading range seen in the last month, there is potential for a bigger corrective move.
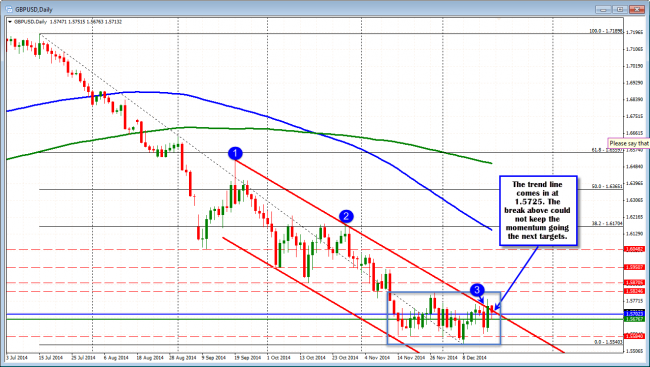
GBPUSD daily chart.
On the downside, the GBPUSD fell below the 100 hour moving average (blue line in the chart above at 1.5701 currently), trend line support (at 1.5697 currently), the 50% retracement of the move down from the November 27 high at 1.56824, but could not get below the 200 hour moving average (green line in the chart above). That moving average currently comes in at 1.5675.
Note how in both Monday and Tuesday’s trading, the pair found resistance against the 200 hour moving average before breaking above and trending to the high yesterday. Broken resistance often becomes support, and that is what we saw when the pair tested the 200 hour moving average in trading today. Needless to say, that 200 hour moving average is shaping up to the a key level going forward and will especially be eyed through the FOMC decision later today. If the price is going to break lower it needs to get and stay below this moving average level. Other support targets on the downside include the 1.5618 – 28 area. There were a number of lows that found support here over the last month of trading. Below that the 1.5684 – 91 will be targeted.

