
The EURUSD is also off to a weak start on the first trading day of the year
The euro gapped lower from December 31 closing levels at the 1.21000 area and the pair has dipped around 73 pips on the day. The average range over the last 22 trading days is around 98 pips (around a month of trading).
ECB President Draghi’s comments on inflation and QE (see Draghi sees low ECB rates for longer period ) are the contributing factors to the pairs weakness. Also the Markit Eurozone manufacturing final data came out a touch weaker than expectations at 50.6 vs 50.8 estimate.
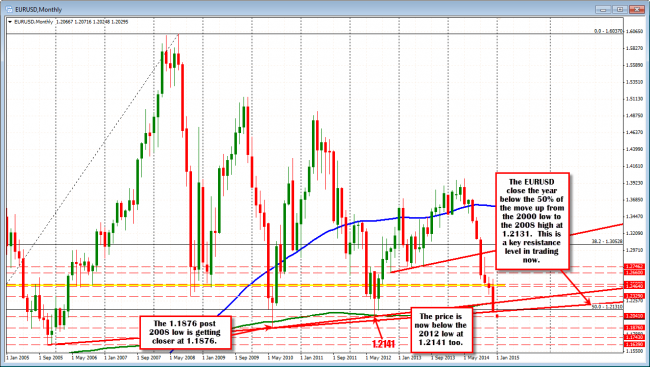
EURUSD is now below the 50% of the move up from the 2000 low to the 2008 high.
The pair is trading at the lowest level since June 2010 (see monthly chart above). The price is moving away from the 1.2131 level which is the 50% of the move up from the 2000 low to the 2008 high (this is the low to high trading range for the post EURUSD introduction). This level will be a key level in 2015.
On the move lower today, the 2012 low of 1.2041 was taken out (see monthly chart above). That level will now be a close resistance level for traders today.
Looking at the 5 minute chart below, EURUSD has been above and below this level in trading today (see 5 minute chart below). In addition, the current new lows are taking the price further away from the 100 bar MA on the chart (blue line – currently at the 1.2048 level and moving lower). Also in that moving average area is the 38.2-50% of the move down from the London session high at the 1.20415-1.20467 area. This area is now close risk for the sellers if the bears are to keep control.
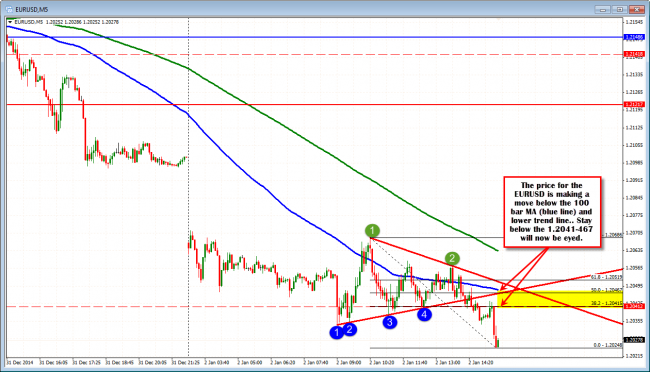
EURUSD on the 5 minute chart is showing weakness
Looking at the hourly chart (see chart below), the price gap lower in trading today, has also taking the price below channel trend line support. On New Years eve, the price stalled at this level but today, not so lucky. The next target on the downside comes in at the 1.2000 area. Below that and traders will be eyeing the 2010 low (and post-2008 crisis low) at 1.1876 (see monthly chart above). It is not that far away.
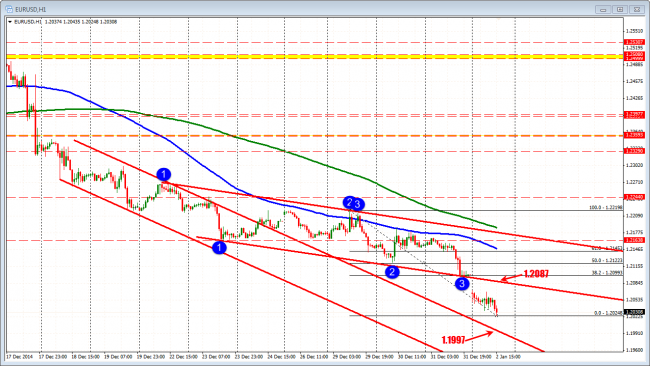
EURUSD hourly chart.

