
The USDCAD is trading at new day highs after breaking above the 117.00 level for the 1st time since July 2009. The price is trading now above the 1.1723 level which is a high price going back to the week of July 5, 2009 earlier in the trading day. This level will now be a close support level for the pair.
With the price trading a multi-year highs, it becomes hard to target upside levels. However, looking at the daily chart a topside channel trend line comes in at the 1.1754 level. This levels becomes the next target for the pair on the topside. Traders who might be looking to book some profits might look to use the level to lean against on a test, but understand the trend higher remains in place.
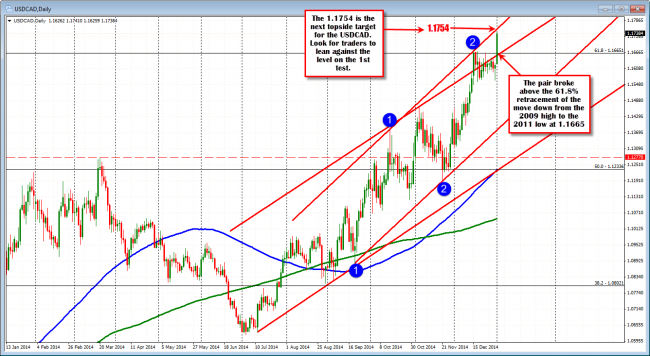
USDCAD daily chart
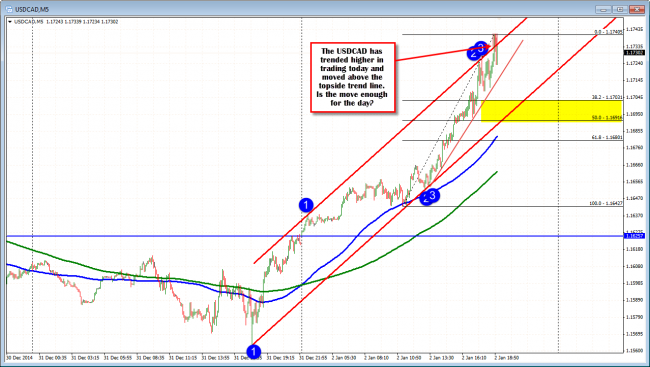
Looking at the 5 minute chart below, the trend higher in the price of the USDCAD is more evident. At the peak just reached the pair moved above topside channel trendline resistance at the 1.1735 level. The high extended to 1.17405. Has the move today reach day an area where profit takers might look enter with both the daily and the 5 minute testing resistance levels?
Trading against a trend like move is always dangerous. So if a trading is entered against the aforementioned resistance levels between 1.1735 and 1.1754, understand that a break above could solicit more upside momentum. If the price is to come down, a move below the 1.1723 high from July 2009 will need to be taken back (and stayed below) if a further corrective test of the 117.00 level is hoped. So watch that level for clues on a correction going forward. Move below and the sellers can breathe a little easier – at least temporarily.
Earlier today, the RBC Canadian manufacturing PMI came out at 53.9. This was down from November’s reading of 55.3. The weaker data, and lower oil prices are helping to contribute to the Canadian dollars weakness from a fundamental perspective
USDCAD pushes against channel trend line resistance.

