
Stocks are feeling their own deflationary forces in trading today with the major indices in Europe and the US hitting the skids.
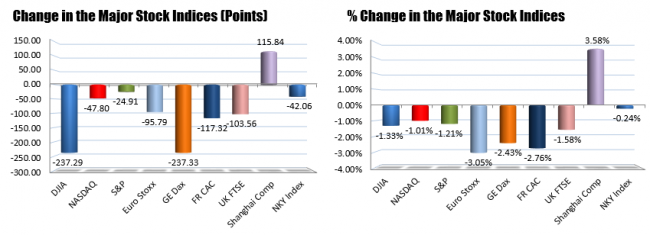
Global stock hitting the skids in trading today.
With oil continuing its slide, deflationary forces starting to take hold, will traders start to think in terms of stock price deflation? Bonds yields are lower with the new bond king, Jeffrey Gundlach talking about US yields possibly heading below 1.38%
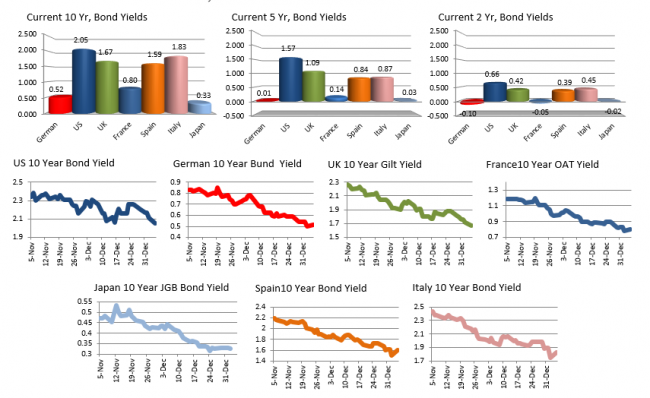
Bond yields are down.
The CRB index is at the lowest level since 2009.
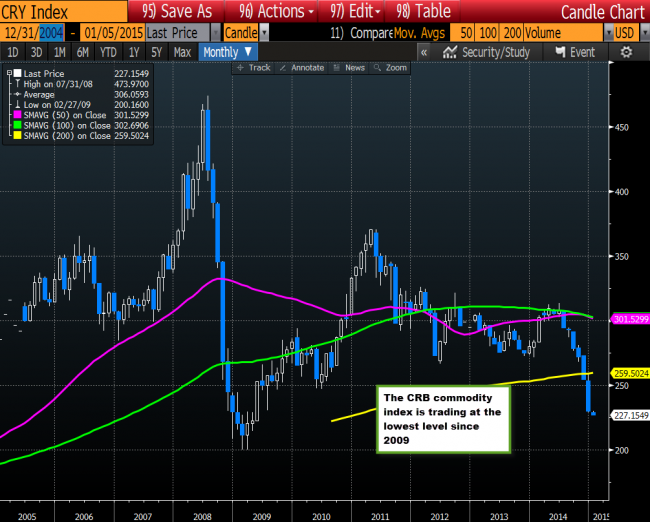
CRB index at lowest level since 2009
Is lower prices for oil and other commodities good or bad for stocks? Deflation can be a very bad if people put off buying stuff, and wages remain low. Sharply lower prices in things like oil, have a bright side and a dark side. Will the more money in the pockets of consumers increase spending or will the job losses from 50% decline in prices have a bigger impact?
The story will play out as time goes by but from a technical perspective, we are entering one of those periods in stocks where the price – and major tools applied to that price – are flashing warning/bearish signs.
Looking at the S&P index chart below, the price last week, tested the high trend line and held. The price than fell and closed below the old top trend line that led to the last correction just a few weeks ago. That slide in the middle of December saw the price fall below the 50 day MA and 100 day MA (yellow and blue MA lines), before quickly rebounding. Now, with the price back below the 50 day MA for the 2nd time in a few weeks (it comes in at 2039.77 today), is the S&P flashing warning signs for the pair? Staying below the 50 day MA will be eyed going forward as the fundamental story plays out. The 100 day MA comes in at 2003.20 (blue line in the chart below) and the 200 day MA comes in at 1959.45 (green line).
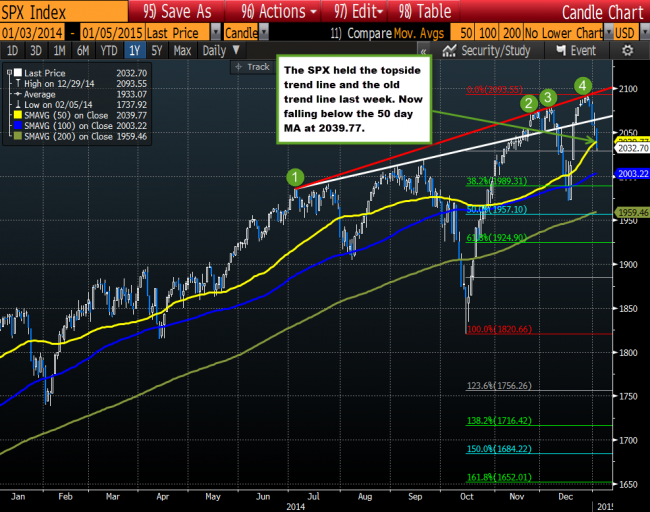
S&P falls below 50 day MA

