
The calendar year is done for 2014 as far as employment is concerned, and a total of 2.953 million jobs were created in the United States. That averages 246K per month. That total is the highest year monthly average since 1999 when the average monthly gain was 264K.
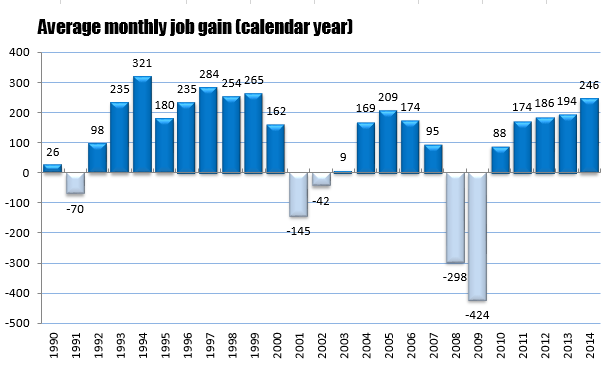
Average Monthly Jobs gains (calendar year)
The prior three years were around 185K. The 60K increase is a 33% bump up from those years. Nice job.
However, were the jobs created really “nice” jobs or are they… not so nice?.
I thought i would dig a little deeper, just to wrap the year up and get a feel for the data.
First off, the Bureau of Labor Statistics has 11 major sectors that they bucket jobs. Below is the distribution of jobs created per sector along with the % of the 2.953M for each.
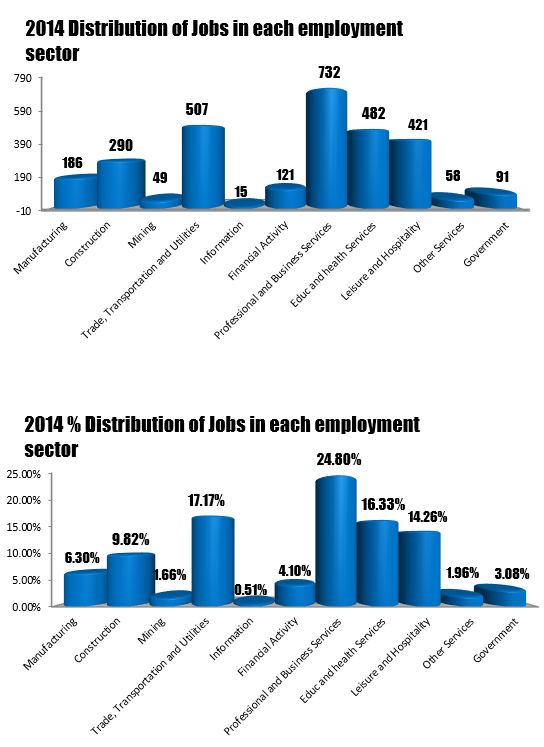
Distribution of jobs per major employment sector
Clearly, the Professional and Business services sector was the star performer, being responsible for 24.8% (or 732K jobs) of the total jobs created. It outpaced the next highest sector – Trade Transportation and Utilities – by 225K. Impressive.
So what jobs within that sector were created?
Digging a little further in the BLS data, I discovered, 10 categories within that sector. Below is a more specific distribution of those 732K new jobs.
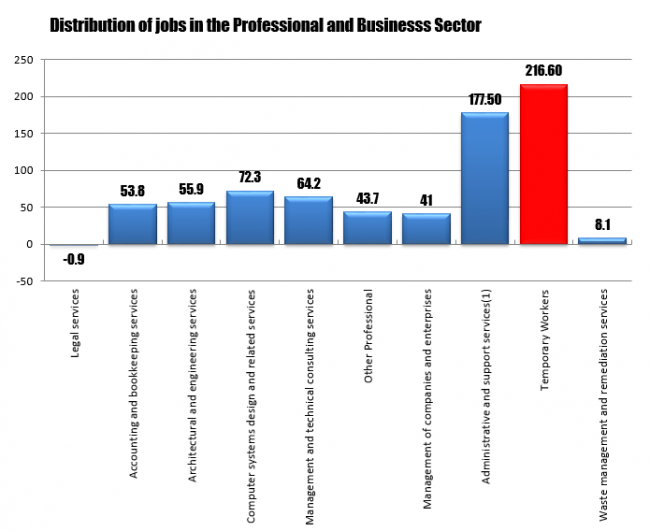
Jobs created in the Professional and Business sector
Although there are solid numbers for higher paying jobs like accountants, engineers, and managers, the biggest increase was in Temporary Services with 216K of the 732K. Why the big increase? A theme in 2014 from employers came from the uncertainty from Washington with regard to health obligations and other employee benefits. As a result, the cost to hire a full time employer rose. So instead of hiring full time, a lot of businesses chose to hired part time and lower the added benefit costs. This is a dynamic that may be with us for a while and most likely contributed to the lower wage data seen through out 2014 Simply put, if a lot of the new jobs are lower paying, it is hard to bump up the average hourly wage data.
So although the total number of Professional and Business jobs is quite impressive, the fact that 216k is in low paying Temporary sector, puts a damper on the data.
The next highest job creation sector was in Trade Transportation and Utilities. That sector had a yearly increase of 507K. Where were the jobs created in that sector?
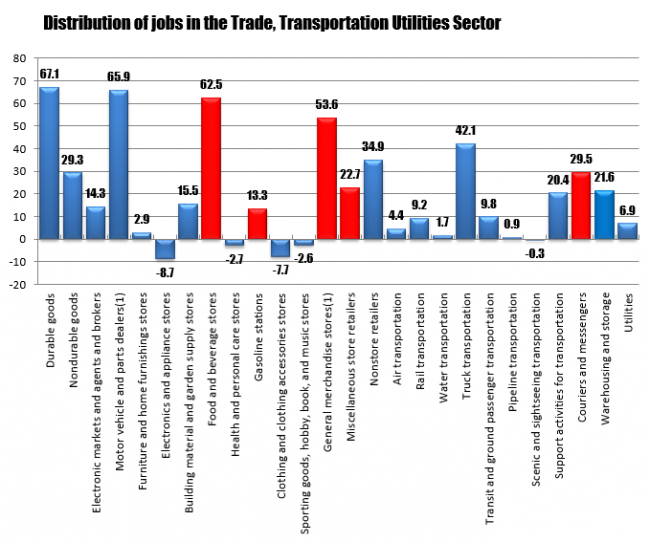
Distribution in Trade Transportation and Utilities.
Again, some of the makeup in the jobs is a little less than what appears on the surface with Food and Beverages store and General Merchandise stores toward the top of the list.
A final sector that often gets attention is in Leisure and Hospitality. In 2014, a total of 421K jobs were created in that sector representing 14.26% of the total jobs created. What can be said about the more specific jobs created in that sector?
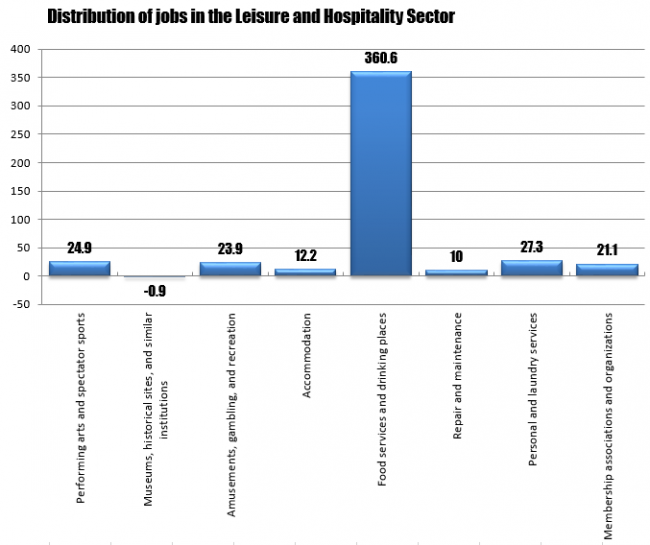
Leisure and Hospitality job creation in 2014
Of the 421K jobs, a large number of the total – 360.6K to be exact – was in “Food services and drinking places”
What can we make of that?
Well, admittedly most jobs in this sector are not high paying. Nevertheless, the fact that they are strong, suggests that those with the high paying jobs are spending discretionary income. What might be more worrisome for the economy is if these jobs were declining. That would imply that those with discretionary income are not spending – even on entertainment.
The sector may also be helping those younger workers who are saddled with college debt and who need additional income from a second job to make ends meet.
So it has elements of good and an element of bad. The fact the jobs are being filled suggests people need the work and they are taking the work. It does not help in the wage area, however.
The final graph- to wrap up the jobs picture for 2014- shows the distribution of the top 20 jobs and the percentage of the total jobs for those jobs. Food services and Temporary jobs take #1 and #3 which again is not the best dynamics.
Overall, I cannot help but think that the glass may not be filled but it is not totally empty. Nevertheless, there still exists a redistribution of jobs which makes the employment picture not as great as it could be. Manufacturing and Construction jobs, traditionally higher paying jobs are still sluggish, 7 years later. That may still be part the pain from the crash. It may also is a result of increased and more efficient economy or manufacturing jobs that have gone overseas. In 2016 it will be interesting to see how the job picture shapes up. This report will be the base for that analysis going forward.
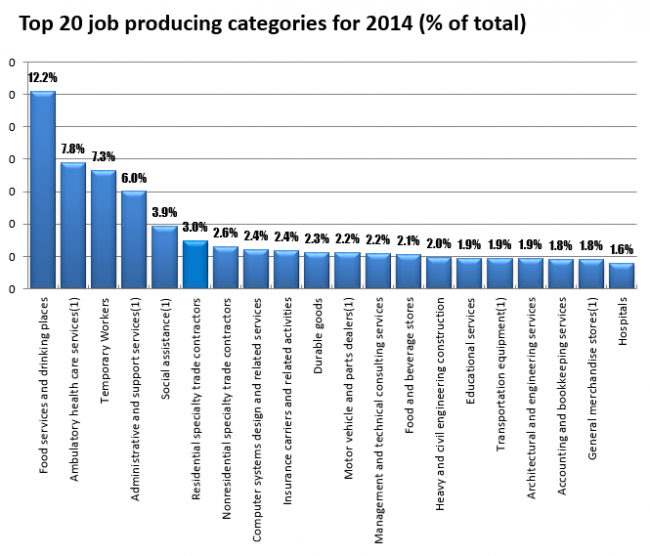
Top 20 job producing categories for 2014

