
While the EURUSD continues the move lower, so too is the EURJPY. The stock markets have been up and down since the decision. The US stock market’s initial reaction was positive but quickly reversed to the downside and is chopping more around. It seems the EURJPY is simply following the EURUSD lower at this point.
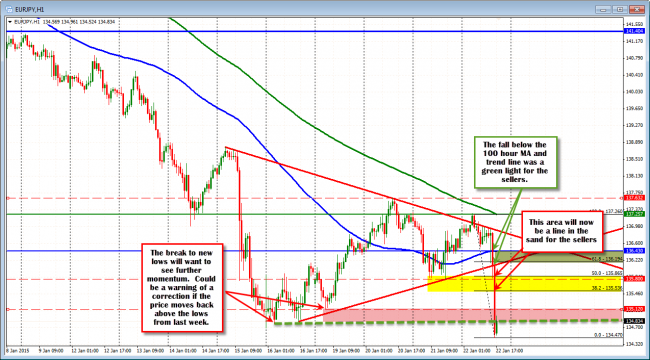
EURJPY hourly chart
The pair has made new year lows in the process – taking out the lows from last week at 135.12 and 134.83 respectively. The market might want to see these levels hold in the short term. A move above may solicit a consolidation/correction phase.
One thing that might support that possibility comes from the daily chart. Looking at it, the low for the day came back down to test the underside of an old trend line. The market has been above and below this trend line since breaking above last September. Nevertheless, the market has found an energy around that level (see blue circles) including in last weeks trading. So a move below the lows may have a cause for pause in the short term as the market takes a breather. Be aware.
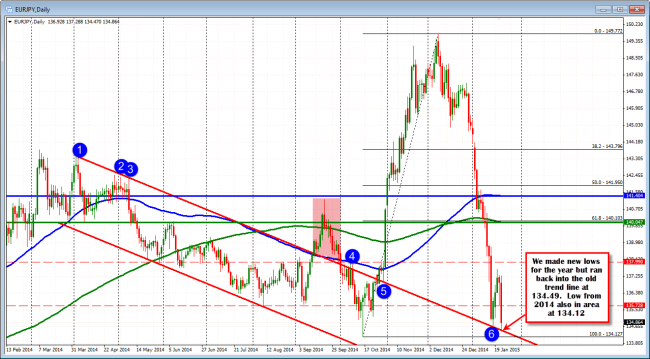
EURJPY tess underside of broken trend line.

