
The GBPUSD is falling in sympathy with the EURUSD , but at a more measured pace. The pair remains in the trading range that has contained and confined the pair since January 2nd. That range extends from 1.5273 to 1.5033. Overall, however, the bias has shifted back to the bearish side as the price is back below the 100 and 200 hour moving averages (blue and green lines in the chart below) and moving away . Those levels come at 1.5137 and 1.5159, respectively.
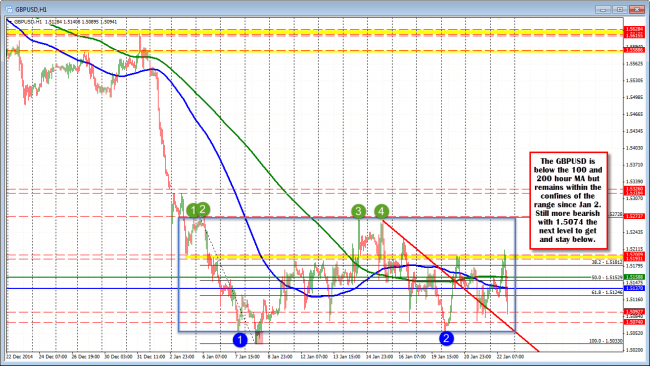
GBPUSD hourly chart.
In the current hourly bar, the price high, was near the 100 hour moving average and has trended away. The pair is currently making new lows and moving below the 1.5095-1.5100 area in the process. In the consolidation period since Jan 9, the market has had a difficult time keeping the price below this area (see hairs of bars where the price moved below, but closed back above in the chart below). On Tuesday, the price fell below and spent some time below, only to also fail. The move back above the 1.5095 level, helped turn the tide back higher.
Will this move lower keep the pressure on and keep the pair below the 1.51000 level. That is the close risk now for traders looking for continued momentum lower. The low for the year and the low going back to July 2014, comes in at 1.5033. Of course if 1.5100 is hard to get below, 1.5000 should also give traders cause for pause. The sellers, however, remain in control with 1.5100 the short term risk.
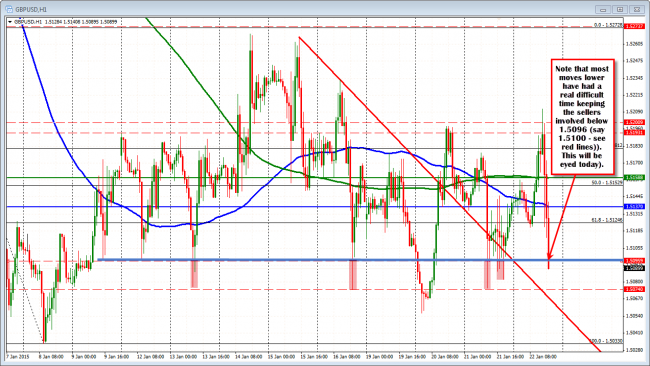
GBPUSD has had a hard time keeping the selling pressure below 1.5100.

