
The EURUSD continues the freefall as it slices through the next target at the 1.1209 level (61.8%).
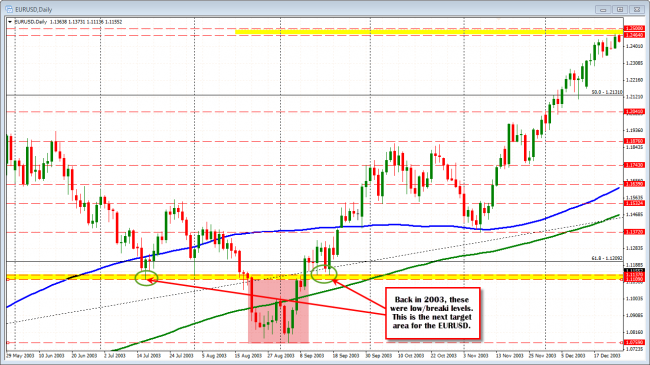
EURUSD from 2003. This is the last time the price was this low.
Back in 2003 (see daily chart from 2003 above), when the price was last at these levels. the 1.1109-1.1137 was an area that traders paused then lifted off. This is the next “target”. Target is the next step. It does not mean it is the low. The sellers remain in control (the 1.1372 low from November 2003 held the correction overnight). Resistance now against what was the next target at the 1.1209 level (61.8% of the move up from 2000 low to 2008 high).
That was back to the past. What about moving and looking back to the present and the future?
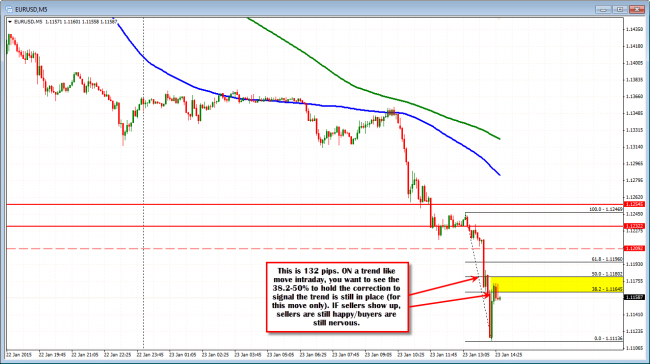
Looking at a chart in the present, the 5 minute chart, the breaking of the 1.1209 level – after stalling just above it – shows that indeed traders were leaning against the level to once again try to find a bottom and get that long awaited correction. The break and stops below, show that traders are using correct money management at these levels AND paying attention to technical levels once again.
From the correction high to the new low, has been 132 pips (see chart below). That typically is a good trading day for the EURUSD. It is a good hour in trading over the last few days. The 38.2-50% correction of that trend-like move is 1.11645-1.11802. This is now short term resistance/risk for shorts. Stay below and the sellers are still in firm control. Move above and stay above and the waters are a little muddy, with 1.1209 the next resistance area.
Corrections are built from taking back control. This is the minimum that the buyers have to prove. If they cannot, are they showing me anything? Nope. If they do, I give them a muddy water situation with the next target proving a little more.
Short term risk for intraday traders.
The train is still moving.

