
The GPBUSD made another move low (lowest level since July 2013) – reaching to 1.49502 (see daily chart below). Getting below the 1.5000 level is a big deal – moved below yesterday – but could not close below the level. Today, the pair took another look but again is finding some buyers ( low at 1.45495). The price is currently trading back above the 1.5000 level and is also above the close for the day at 1.50079. Bears don’t like new lows and higher closes so be aware.
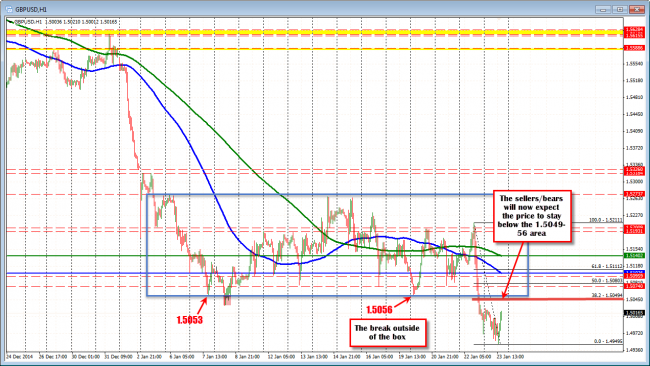
GBPUSD hourly chart
Looking at the hourly chart, the fall outside of the blue box that has contained the pair (around the 1.5650 level) will now be a level that sellers will want and expect the price to stay below if they are to remain in control. So corrections toward it should solicit at least cause for pause.
On the downside, the 1.5000 level and the 1.4995 should be risk for those buyers now. The 1.4995 is the 200 bar MA on the 5 minute chart below (green line). The 1.5000 is a natural support. The close from yesterday is also a level that should find traders leaning against as well.
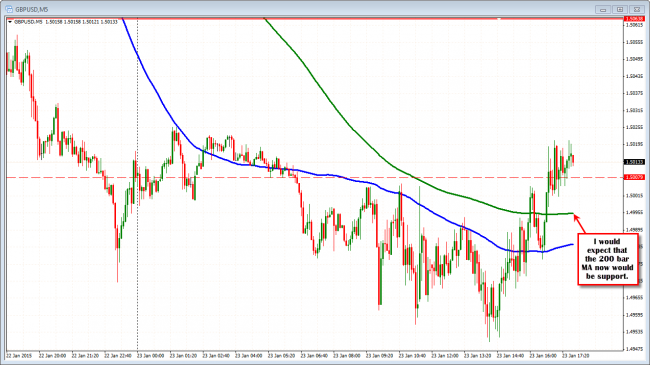
The 1.4995 to 1.5007 should be support now.

