
The EURUSD is trading in a narrow 59 pips trading range so far today. The average over the last 22 trading days is 123 pips. So there is room to roam on a break either to the upside or to the downside in trading today. Note, however, that overall, ranges in most currency pairs are well below their 22 day averages (about a months worth of trading) as traders take a breather from a more volatile period.
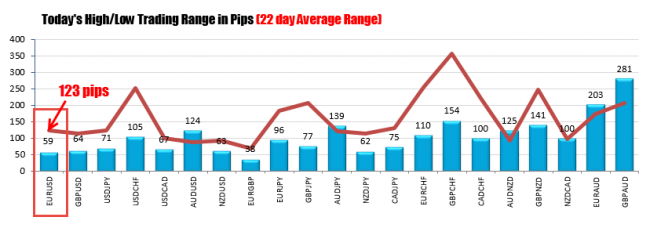
Current low to high trading ranges vs the 22 day average range.
Another contributor of course, is that traders are buying time until the FOMC interest rate decision later today at 2 PM ET.
The Fed is expected to keep policy unchanged. The question is whether the statement will tilt, further to the dovish side as a result of lower oil and commodity prices, a shifting in bond yields, not only in the US, but overseas as well, and the potential impact of the continued dollar strength (Fed preview: Time for the Fed to forget rate hikes). These are all things that could shift the feds liftoff point. On the other hand, with Fed chair Yellen not holding a press conference following the decision, impact from the events in Europe still fresh, relatively strong US employment and a stock market that is up and down but overall steady, it probably gives the Fed an opportunity to stall and see what’s up in March. As Adam points out in his excellent analysis, this may be one of those cycles where what is said between meetings might be more important than what might be said today. So it will be up to the markets interpretation at that time.
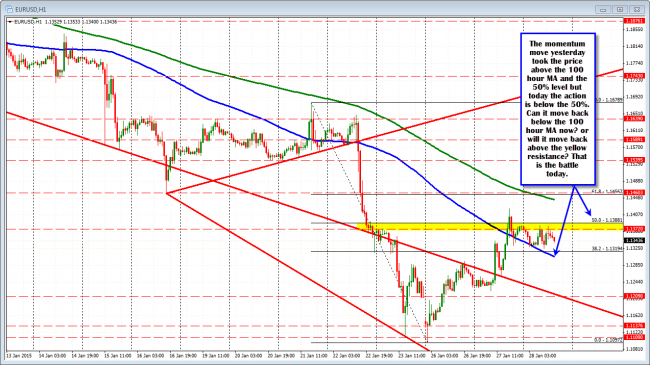
The story for the EURUSD is being played out on the hourly chart.
In the meantime, from a technical perspective, the EURUSD is:
- Lower on the day (closed at 1.1379)– bearish
- Below the 1.1372 level which was the low from November 2003. The highs today extended up to 1.3781, but there have been no closes – on an hourly basis – above that 1.1372 level in trading today– bearish
- The price has remain below the 50% retracement of the move down from last week’s high to this week’s low at the 1.13881 level. Yesterday, the pair moved above this level in close above. On one hourly bar that was it – bearish.
On the bullish side, the pair remains:
- Above the 100 hour moving average (blue line in the chart above) currently at 1.13052.
- Above the 38.2% retracement of the same move down from last week’s high at 1.13194
Also, on Monday, the price for the EURUSD made new lows on the back of the Greek election results, but quickly started a rally back to the upside. Yesterday, the pair continued the correction higher, holding support at what I considered a key technical trend line (see: Forex technical trading: There is something about that trend line on the EURUSD ) . As a result, there are some more balanced technicals in the intermediate term for the pair.
For me, the action today without an attempt to push toward the 200 hour moving average (green line in the chart above), suggests that the upward momentum seen early in the week, is fading. In a trending market that raises potential red flags (the overall trend is still down for the EURUSD).
However, if the bears are to reassert themselves as the dominant, they still need to push the price back below the 100 hour moving average (blue line in the chart above) and stay below that level. Below that the 1.1209 level will be another key line in the sand (see weekend technical video at Video: What’s next for the euro). This is the 61.8% of the move up from 2000 low to the 2008 high. On Monday, the price extended back above this level. Yesterday the low could only get to 1.1222. Falling back below that line going forward is key for a further bearish picture going forward.
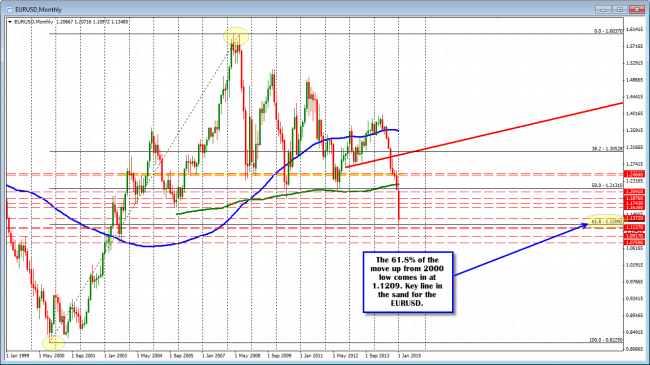
The 61.8% of the move up from the 2000 low to the 2008 high comes in at 1.1209 level.
The closest risk for sellers currently is probably a move back above the 1.1372 level, then the 50% retracement level at 1.1388. With the current price trading between the 100 hour MA below, and the risk level above at 1.1372, it may make sense (for new trades) to be more patient and wait for extremes. The market is more likely to trade up and down pre-FOMC. Also, although, I prefer a downside trade from this point, the flows from pre-FOMC can be an influence. So I would want to keep risk as small as possible on a new trade from here. Those who shorted against the 50%, you have good trade location with risk defined. Longs…quite frankly you are ok as long as the price remains above the 100 hour MA. I just worry that the longer term trend is still to the downside for this pair and the correction we are seeing has taken some of the oversold out. We did move 322 piips pips higher from the low.

