
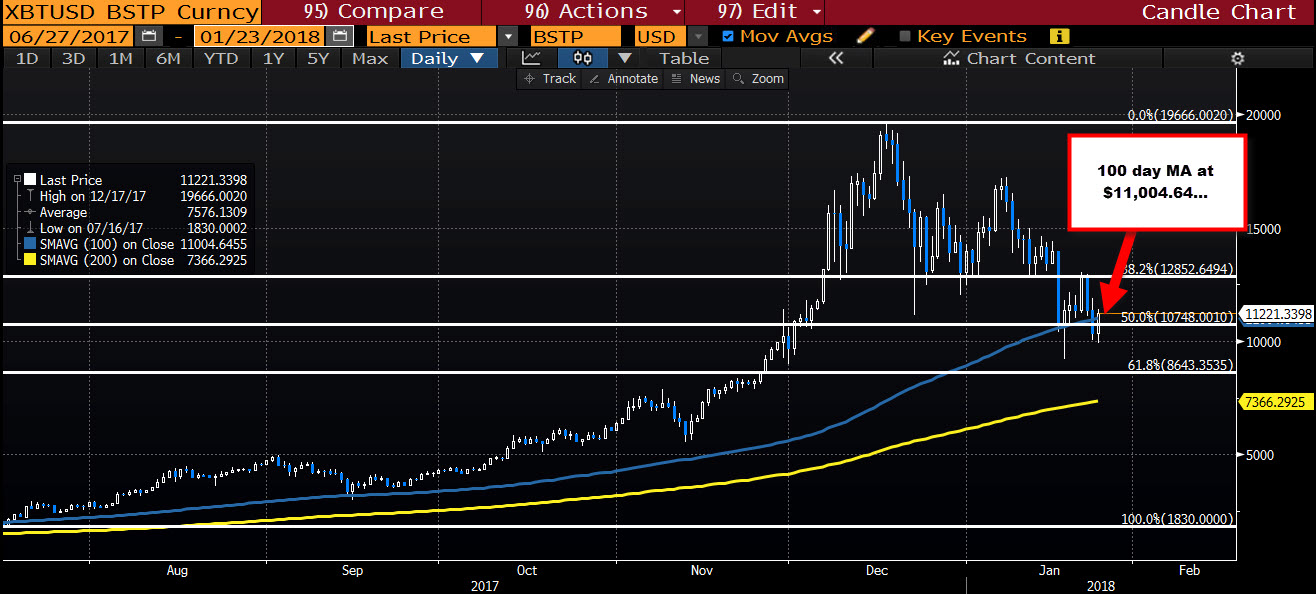
One day close below the key MA level
The price of Bitcoin finally closed below the 100 day MA yesterday. That MA currently comes in at $11,004. The close yesterday was down at $10,350. The last time the price closed below that MA on the Bitstamp exchange was July 17, 2017 (for two days). The price move also back below the 50% retracement at $10,748.
However, the selling could not be sustained.
We currently trade at $11,200 above both the 50% and the 100 day MA.
Technically, that swings the trading bias back to the upside (bulls) - at least on the daily chart.
Drilling to the hourly chart below, the pair has a key area above that will help define more bullish or more bearish going forward.
The 100 hour MA comes in at $11,567. The 200 hour MA comes in at $11,672. The high today has only gotten to $11,409.
If the digital currency is to push higher as a result of the move above the 100 day MA, breaking the 100 and 200 hour MAs would give the buyers more confidence.
Fail.... and the sellers may come back in - especially on a move back below the 100 day MA level.
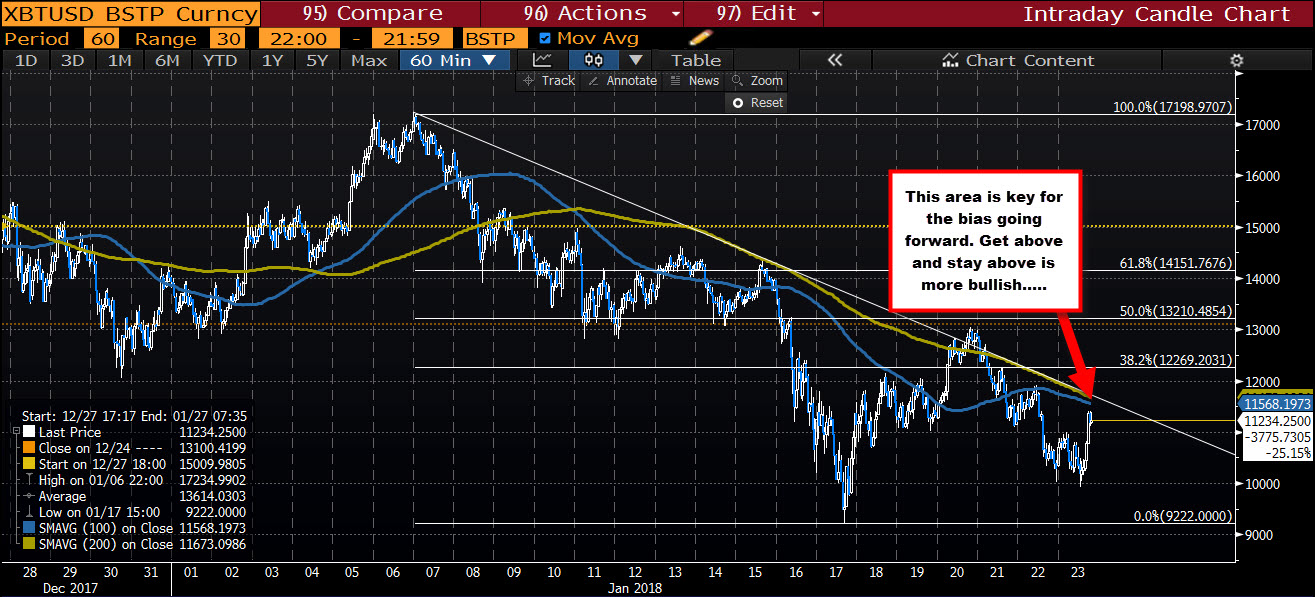
SUMMARY: So although there is a bullish development above 100 day MA, the buyers have a little more work to do if there is to be more upside potential. Get above the 100 and 200 hour MAs will give the needed push.
Fail to break, and buyers today, will turn to sellers. A move back below the 100 day MA will be more bearish.

