Day two of Chase’s Guest Trader slot and by one way or another he certainly had baptism of fire. You can catch up on day 1 here.

Live at the Portobello gold
Hi everyone!
Day two in the hot seat, and since I got a few questions about it yesterday I thought I’d talk a little about my trading style, and a bit about how I developed it. And also the Yen.
I started drawing lines on stock charts in the newspaper when I was about fifteen. I noticed correlations and patterns that were consistent across seemingly unrelated stocks. I began investigating the fundamentals behind the companies I looked at, and I became aware that the movements of financial markets were a gestalt phenomenon.
So I learnt about technical analysis and global risk trends (while studying Literature and Philosophy…). I started picking stocks in late 2007, and we all know what happened the year after.
I managed to ride out the financial crisis with a 20% gain, and then repeated that performance nearly every year until now. That made me quite dangerously smug.

My approach to stock picking was simple: find a sector with good growth prospects and learn about it. Then examine the top companies in that sector until you know them like you own them, and pick the one best positioned to outperform its competitors. Then move on to another sector. Only sell if a sector gets into trouble.
This has almost definitely influenced my Forex trading behaviour.
For me, trading is about figuring out what’s strong and what’s weak, and then finding an opportunity to exploit that. The strong/weak part comes from gaining a fundamental understanding of all of the markets I’m looking at, and from staring at charts looking for correlations and divergence. A country’s fundamental situation is more complex than a stock, but the picture becomes clearer with deeper knowledge.
Then you look at the charts. One of the first painful lessons I learnt trading Forex was that just because you think the Euro should be collapsing, doesn’t mean it’s going to. I realised that a fundamental understanding was essential, but that the key to profitability lay in accurate technical analysis.
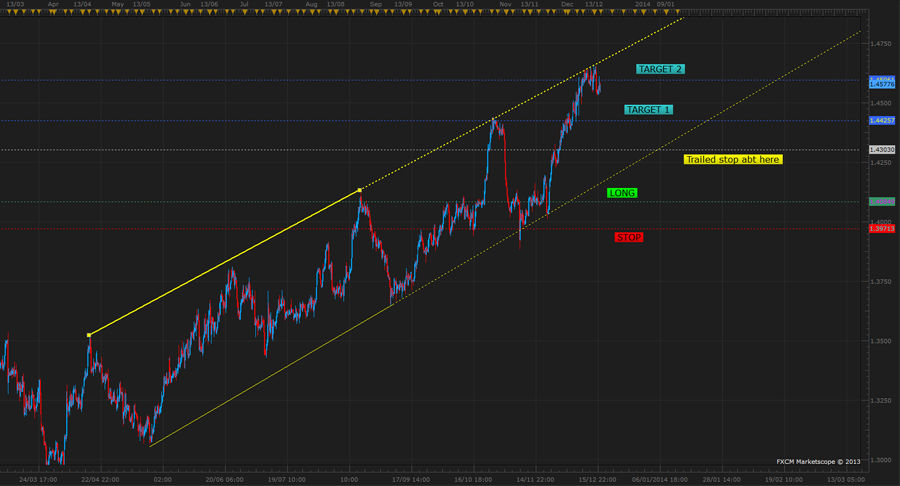
Before I go into my actual strategy, I’ll just show you how I work – with the caveat that this is not the only strategy I employ. Here’s a trade I took recently on EUR/CAD. The entire analysis process involved drawing two lines and staring at them for an hour.
EURCAD-trade
Sadly it’s not always this simple, but it was one of my better trades this year. Here’s my mental process:
- Identify a strong trend. Not always very easy, but this one was clear as day. If there is no clear trend line, identify areas of strong supply and demand.
- Draw the lines. For interest, where the line becomes dotted marks where price was when I drew it – so I can see in retrospect how reliable my trend lines are.
- Fundy check: should the Euro be going up? Probably. Should the Loonie be going down? Yep.
- Is there anything major in the way? Monthly pivots, long term descending trend line, significant moving averages, etc.
- Buy the dip. Stop below the recent swing low (in this case we had two close together, so I went for the more aggressive level)
- Target the most recent swing high (T1), and then next resistance (T2). In this case, the channel top provided a good second target.
- Take money off the table when the market makes it available, and trail the stop.
Simple as that. I seldom use indicators, though I will occasionally consult RSI or a Slow Stochastic to spot things like divergence or price extremes. Most of the time when I do this though, it’s because the picture isn’t clear enough for me to easily identify the trade.
It’s not the highest probability strategy in the world, but it’s easy to apply, and money management ensures that my losses are small and my winners are massive. That was over 500 pips by the end of it.
As for risk management: I stick to the standard 1-2% risk, but apply this to my total investment capital rather than a single trading account.
Lastly, I have a few rules that I apply:
- If you don’t understand what’s going on, don’t trade it
- After a strong move, there will always be a better level to get in
- Don’t buy something that’s falling or sell something that’s rising. In other words, don’t try pick tops/bottoms. New trends though, that’s a different matter.
- If you miss a move, or your order gets missed by 3 pips, don’t run after it
- Trust your instinct, but trade what you see
- Don’t trade impulsively on news events, unless that event creates exactly the set up you were looking for
- If there’s no action, play guitar
There you have it. The major challenge for me is not better technical analysis. I know the markets I trade well enough to anticipate their quirks. I know my strategy generates more good trades than bad and that given a decent sample size, I’ll average winners. The challenge is learning to think like the house, not the punter.
Over-trading, revenge trading, impulse trading, taking unnecessary risks – these are things that we all have to overcome to be profitable traders. It’s only by methodically executing your strategy, and following the rules you set yourself, that you can become both profitable and emotionally equipped to stay that way.
If you can manage the head game, but you’re still not profitable, you can always adjust your strategy to generate better trades. But it will never work out if your trading is governed by the fear of losing money, the frantic need to “make it back”, or the conviction that you’ll be right this time.
So with that out of the way, let’s look at some charts!
Today was fairly quiet so I thought I’d jump straight into the Yen. I think most of us will agree that the technical picture across USD/JPY and the Yen crosses is complex except on higher time frames. If you’re anything like me, your USD/JPY chart is starting to look like those “manifestos” handed out by the dude at the traffic lights with the crazy eyes.
So here’s a much cleaner picture: the Nikkei 225 (4hr)
Nikkei-4HR
I love how simple this picture is, and it makes me wonder why I’ve spent so much time scratching my head over EUR/JPY. It did look a lot better yesterday, but we work with what we’ve got.
I want to put USD/JPY next to it, and pay attention to the action on Friday.
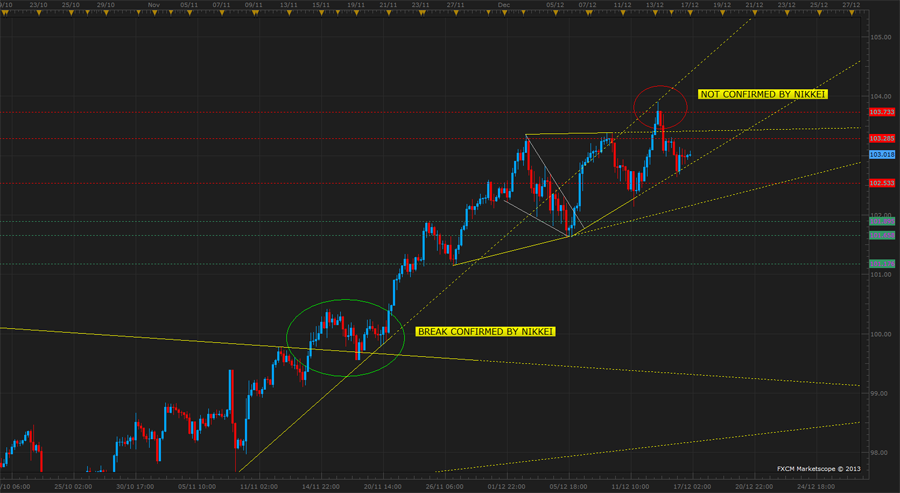
USDJPY-4hr See what I mean about crop circles and the government?
(On a side note if we have any fractal guys reading, I’d love to hear your thoughts on this one)
The Nikkei is the gatekeeper here. It’s not the only driver, for sure, but without commitment one way or another, any move from a Yen pair is likely to have a hard time with follow through. I know I’m stating the obvious, but it took me long enough to catch on to this concept.
I rarely trade breakouts. But these are exciting times, and even though liquidity is thin, we have some fairly significant event risk coming up. I’m already long USD/JPY from 102.50 as I mentioned yesterday, so I’m not really looking for more exposure here. However, I’ll be keeping a close eye on the Yen as the FOMC meeting unfolds.
Tectonic plates are shifting in Japan and the US. The move we’ve seen this year gave us some really exciting times. At the heart of it is a simple change in supply and demand factors affecting two things that can be bought and sold.
What we know is that there are likely to be more Yen in the market in the future, and fewer US Dollars. We don’t often know how much, and exactly when, but that’s why our charts look like they do. Any move other than up goes against the longer term fundamental picture. There is often opportunity in shorting Yen pairs, but it makes me break out in a rash.
In retrospect, I don’t particularly like USD/JPY best for the upside. I took the position because the tech was cleanest and it didn’t look overbought nor excessively weak. Which brings me to:
Backing the fastest horse
This is always a tough one, and I often seem to get in on the right move, but on the wrong pairs. I focus mainly on USD/JPY, GBP/JPY, EUR/JPY and AUD/JPY, and generally avoid CAD, CHF and NZD.
For anyone new to these pairs, here’s a few things I’ve worked out about trading the Yen:
- When they’re in consolidation, expect a LOT of chop
- When a real move happens, you’ll know about it. Don’t be fooled by velocity inside ranges.
- Price will most often move to extremes before a reversal. The dip before the real money gets in is always deeper than expected, and can break previous lows.
- EUR/JPY laughs at your trend lines, and eats stops for breakfast. Trade the edges and do it with conviction. Wait for the weak stops to be taken out, and don’t be one.
- If one of the crosses is breaking out but the others aren’t, the only two trades are fading the move or sitting on your hands.
- If the Nikkei’s going the other way, stay away.
I’m going to do a quick run through of the main crosses, and then you guys can tell me which ones you like best – for a move in either direction J
EUR/JPY
EURJPY-4hr
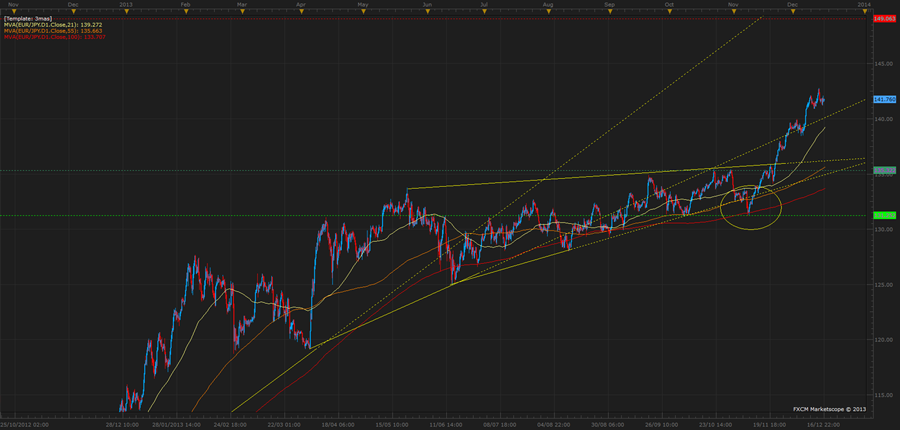
A strong Euro and weakening Yen has lit a rocket under this pair. There’s a reasonably clear five waves up though, and daily RSI has peaked above 70 and is now diverging (not shown on chart). That flashes warning signs.
Best support I can see is the broken triangle top/55DMA at around 136.00, so to enter I would prefer a low around this area. 140.00 and 138.00 could also offer support (previous swing highs) but I don’t like the Risk/Reward at those levels.
To the upside the next significant resistance is at 149.00 – only 750 pips away from where we are now, and 1,300 up from my preferred buy level.
GBP/JPY
GBPJPY-4hr
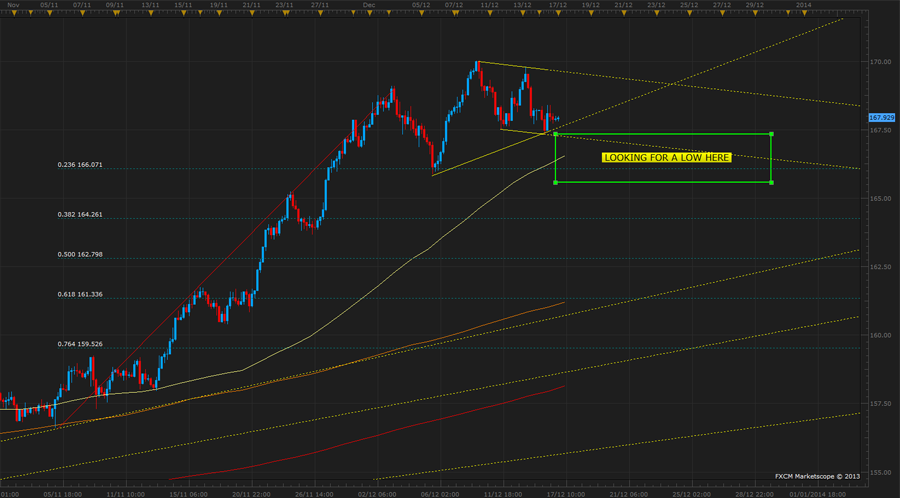
This pair, too, is on a journey to outer space. But we’ve hit a speed bump. We had a beautiful little bounce off the 0.236 fib, and now it looks like a bull flag is forming.
I quite like this little channel, but what I want it to give me is a test of the 166.50 – 165.50 area and a clear rejection of these lows. A proper break opens up a fan of ascending trend lines and fibs, as well as the 55 and 100 day moving averages. It could get messy.
I’m short GBP/USD because of reasons, but that stop is at break-even, so I’m free to pick up some more Sterling exposure. If everything plays out, my Cable short will hit its target around the time when GBP/JPY gets into my buy zone.
That would be nice.
AUD/JPY
AUDJPY-4hr
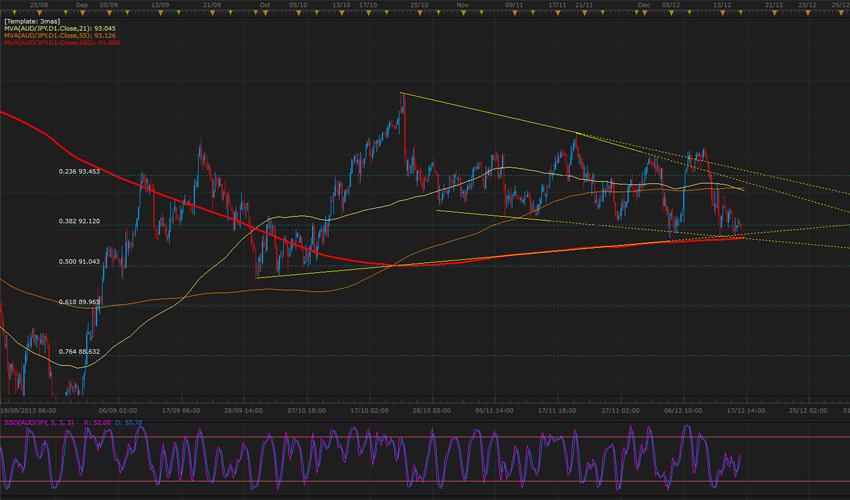
I looked at this yesterday but I want to give it a more thorough eyeballing. I’ve added the Slow Stochastic, because it’s been giving nice signals at the edges of this consolidation zone.
Right now we’re at a great confluence level: falling channel, rising wedge bottom, 100DMA and 0.382 retracement of the Aug – Oct move. A break lower here, confirmed by the Nikkei and the other Yen crosses, looks very interesting.
I would sell a break and retest of 91.80 if the above conditions were met. This is the only pair where I’m slightly bearish, though I would take a look at USD/JPY and EUR/JPY if the Nikkei really went to hell in a handbasket.
NZD/JPY
NZDJPY-4hr
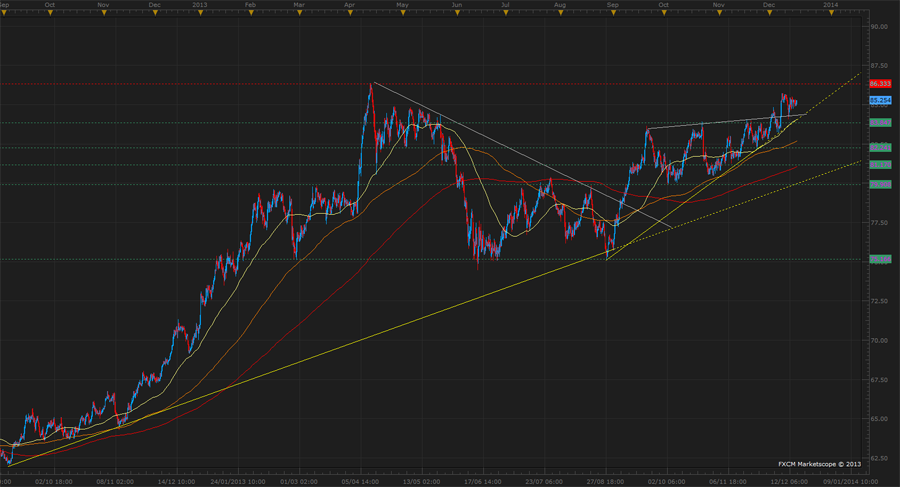
I’ve put this one up since there’s a lot of interest. This might not be the best mover, but if the carry’s in your favour that’s better than a poke in the eye with a sharp stick.
We’ve actually had a quiet little mini-breakout of the rising wedge, and the pair looks to be coiling for another look at the October high of 86.39.
In the shorter term, a buy at around 83.85 (broken wedge top/rising trend line/21DMA) looks good for another attempt at this high.
So, which one do you guys think has the best move coming up this week?
That’s all from me – see you tomorrow, when I believe we have some kind of event risk in the evening.
Chase


