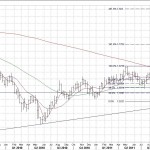
I’m bullish on the GBP and I was long of GBP/USD until yesterday when I sold out because of the attached weekly chart (and the GDP number on Wednesday which is expected to be a bad one). The question we need to answer is whether the cable is in a consolidation phase of a major downtrend or whether its forming a solid base from which to launch off?
- Lower highs on weekly chart; 1.7040, 1.6760
- Bullish trendline off 1.3500 through 1.4230 has held nicely
- Double-bottom at 1.5230? With neckline at 1.6165!
- Possible 5-wave interpretation from 1.6760 to 1.5230 and the 61.8% of this move is holding thus far (it comes in at 1.6175)
Either way, 1.6175 is looming as an absolute VITAL KEY level. If we get a confirmed bullish break above then I’d expect bullish momentum to really accelerate towards 1.6760. If the resistance level holds then we should probably fall back towards 1.5600 very quickly.

