
The market is preparing the press conference from Mr. Draghi at 8:30 AM ET. That event along with the US Employment report should ignite some action in the trading for the EURUSD. For the week, since midday Monday, the EURUSD has been in a 1.2875 to 1.2967 trading range. This is nothing to write home about. What does it say? It speaks to me that the market is unsure of the direction, needs direction, is waiting for the buyers or sellers to take control and trend the market.
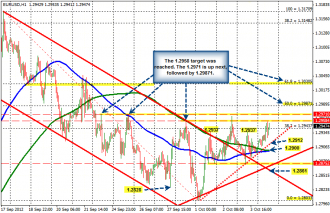
From a technical perspective, the market has leaned the bias to the upside from action today. The price at the close yesterday, kept on finding support against the 100 hour MA (blue line in the chart above), but was capped by sellers at the 200 hour MA (green line). However, in the early asian session, the price moved higher and the market has stepped higher since that time.
The move higher has reached the next targets at the 38.2% of the move down from the September high at 1.2944. If the momentum higher is to continue to the upside the next targets to get through include:
- The high from September 28th at 1.2958 (high reached 1.2954 today).
- The 1.2970 highs from September 24 and September 25th
- The 50% of the move down from the September high at 1.29875
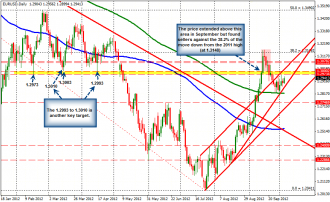
- A key area for me comes from the lows off the daily chart in March and April. In March the lows came in at 1.3003 and 1.3010 and the market bounced. In April the low exended briefly to 1.2993 and bounced. Getting above this area, puts the price in the non trending range that gripped the market from Feb to early May. I would consider this a significant area for trading today/tomorrow if the bulls want to trend this market higher.
On the downside the levels to eye would be:
- The 38.2% of the move down from September at the 1.2944 level
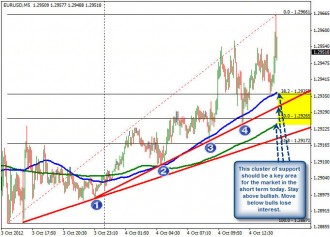
- 1.2930 is a trend line connecting 4 separate lows on the 5 minute chart (see 5 minute chart below). This is between the 100 and 200 bar MA (at 1.2936 and 1.2925 respectively). If the price bias is going to remain bullish, this area should be close support for traders. Move below and the bias could switch more to selling
- Trend line support at 1.2912
- The converged 100 and 200 hour MA (see blue and green lines in the hourly chart above) at the 1.2900 area. When the 2 moving averages converge with the price there tends to be a move away. A break below should see further momentum selling
- Lows from October 1 and October 3rd at 1.2875 would open up the downside even further.
Keep in mind that on a sharp move lower, the 200 day MA comes in at 1.2922 (green line on the daily chart). This was breached Monday (low reached 1.2903) but when the price moved back above, the market did not look back.
The bias is positive but can change dependent on comments (and other news today). The market should follow the technical levels that have been mapped out, however. It built them in the non -trend trading, it tends to follow them as the market moves outside of the ranges.

