Forex news for trading on July 26, 2017
- US Senate votes against Republican proposal on healthcare
- Dow leads the way today. Record closes for Dow and Nasdaq
- So much for that bond selloff
- Here are the major upcoming data and events on the Fed calendar
- Reactions to the FOMC statement
- NZDUSD trades at highest level since May 2015
- Bill Gross: Weaker dollar plays right into Fed goals
- How the FOMC statement changed (and why the market moved)
- Dollar moves lower after FOMC decision
- The FOMC statement for the July meeting
- FOMC decision July 26, 2017: Fed leaves rates unchanged at 1.00%-1.25%, as expected
- ECB's Nowotny says it's reasonable to discuss reducing intensity of stimulus
- If financial conditions are a bigger part of the Fed equation, then there is a good reason to hike soon
- TD sees a bounce coming in USD/CAD but will look to sell it
- US sells 5-year notes at 1.884% vs 1.895% WI bid
- The bond market has a big bet on a hawkish Fed
- European stocks ending the session with gains
- North Korea could test ICBM later today
- DOE weekly US oil inventories -7208K vs -3000K expected
- Trump says decision on steel imports coming "very soon" err, "fairly soon"
- June US new home sales 610K vs 615K expected
- Whatever it takes five year later. Success or failure?
- Sessions tells the White House he won't quit
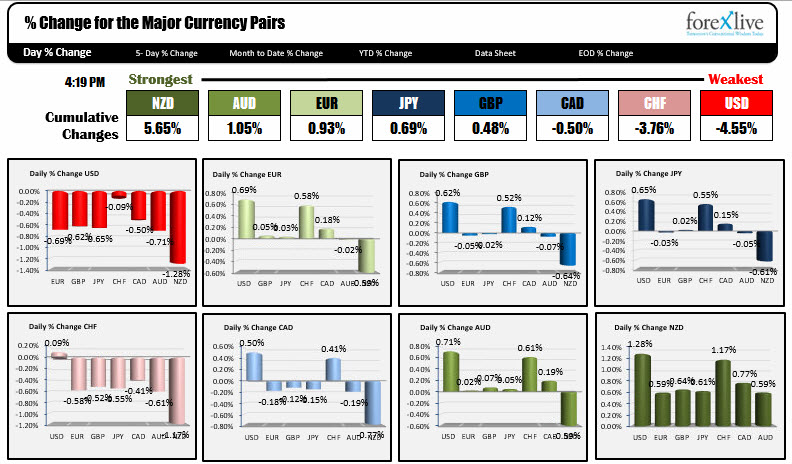
- The strongest and weakest currencies as NA traders enter for the day
A snapshot of other related markets outside of FX shows:
- Spot gold up $10.30 or 0.83% to $1260.35. The lower dollar propels Gold higher.
- WTI crude oil is ending up $0.83 or 1.71% to $48.71
- US stocks ended little changed. The S&P rose 0.03%. Nasdaq rose 0.16%. The Dow rose 0.45% but if you take out Boeing (up 10%), the Dow would have been down. Nevertheless, the Nasdaq and Dow closed at record levels today.
- US yields were sharply lower: 2 year 1.355%, down 3.4 bp. 5 year 1.8298%, -6 bp. 10 year 2.289%, -4.6 bp. 30 year 2.893%, down -2.4 bp
If you were looking for a more hawkish/transparent/confident Fed, the market certainly did not see it in the FOMC statement today. It is not that the Fed said they would not start taper or continue to raise rates. However, the sentiment may be that the Fed may be downshifting the tightening cycle from 3rd gear to 2nd gear, while the QE gear remains in park with a potential to go to 1st gear (and only 1st gear) "relatively soon". As a result, the dollar got hammered after the FOMC statement.
In other news today, a little before the FOMC statement, ECB Nowotny was on the wires saying he was in favor of taking away some of the ECB punch bowl. This helped to get the EURUSD off support near the 1.16157 level. That level was the high from 2016. It was broken last Friday. Today the EURUSD tested that level (low reached 1.1612). The dollar weakness sent the price sharply higher and ultimately through the 1.1711 high from August 2015. The pair is closing at 1.1733. The high reached 1.17395. The 38.2% of the move down from the 2014 high is at 1.1735. So the area has reasons to pause. Ahead, the 200 week MA comes in at 1.1794.
US new home sales were about as expected today (610K vs 615K estimated). It did not have a large impact at the time.
Other fundamental news came from the oil inventory data. The estimate for crude oil was a draw of -3000K, but the private API data from yesterday showed an oversized -10,000K draw. When the number came in at -7208K it was closer to the private number. The price of crude oil kept the most of the gains. That helped to keep a lid on the USDCAD, although technically, that pair did breach its 100 hour MA for the 1st time since July 12th. The break was only for a few pips, however, and the price fell back down. IN the new day earmark the 1.2372 level. That is the 200 week MA. The price has not traded below the 200 week MA since April 2013. I would expect buyers against the level on a test.
What other technical trends are in play as a result of the dollar selling today?
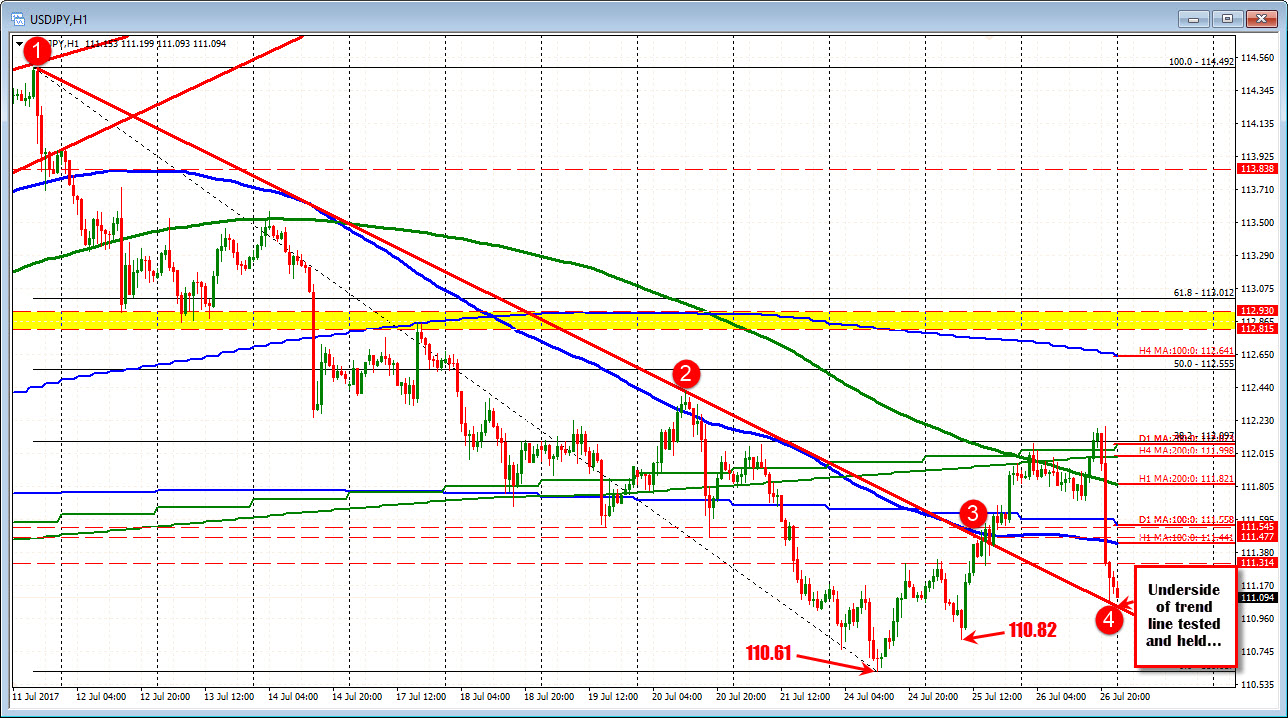
For the USDJPY, the pair fell back below its 100 day MA at 111.558 and 100 hour MA at 111.44. The low did stall at the underside of the broken trend line at 111.04 (see hourly chart below). Do buyers come in and retest the 100 hour MA or 100 day MA? Sellers are in control but a break below the 111.04/111.00 will open up a retest of the lows this week.
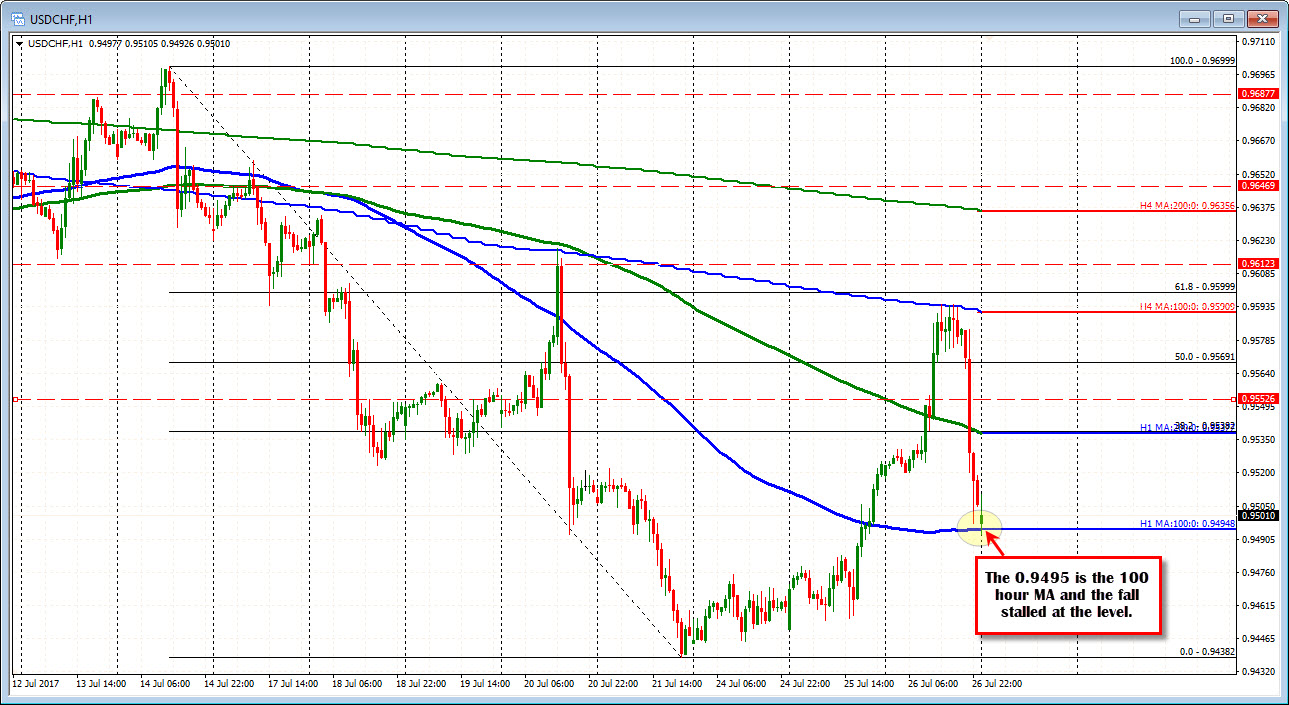
The USDCHF rose over the last two trading days and in the process moved back above the 200 week MA. The gains were supposedly helped by SNB buying. A more hawkish Fed would have sent the pair higher off low levels. That was not to be. The dollar selloff took the USDCHF back below the 200 week MA at 0.9554, and take the price to support at 0.9494 to 0.9500. The question in the new day for this pair is does the SNB keep selling the CHF in the new day? Technically, the 100 hour MA and the 200 hour MA (green line) at 0.9539, will give the clues.
The NZDUSD moved above the high from 2016 at 0.74847 and the 50% of the move down from the 2014 high at 0.7480. The pair closed at 0.7516. The break continues the bullish run for the pair and sets that level as risk for longs now. Stay above and the bulls are in control. Move below, and there may be some additional corrective activity. The trend remains your friend in this pair.
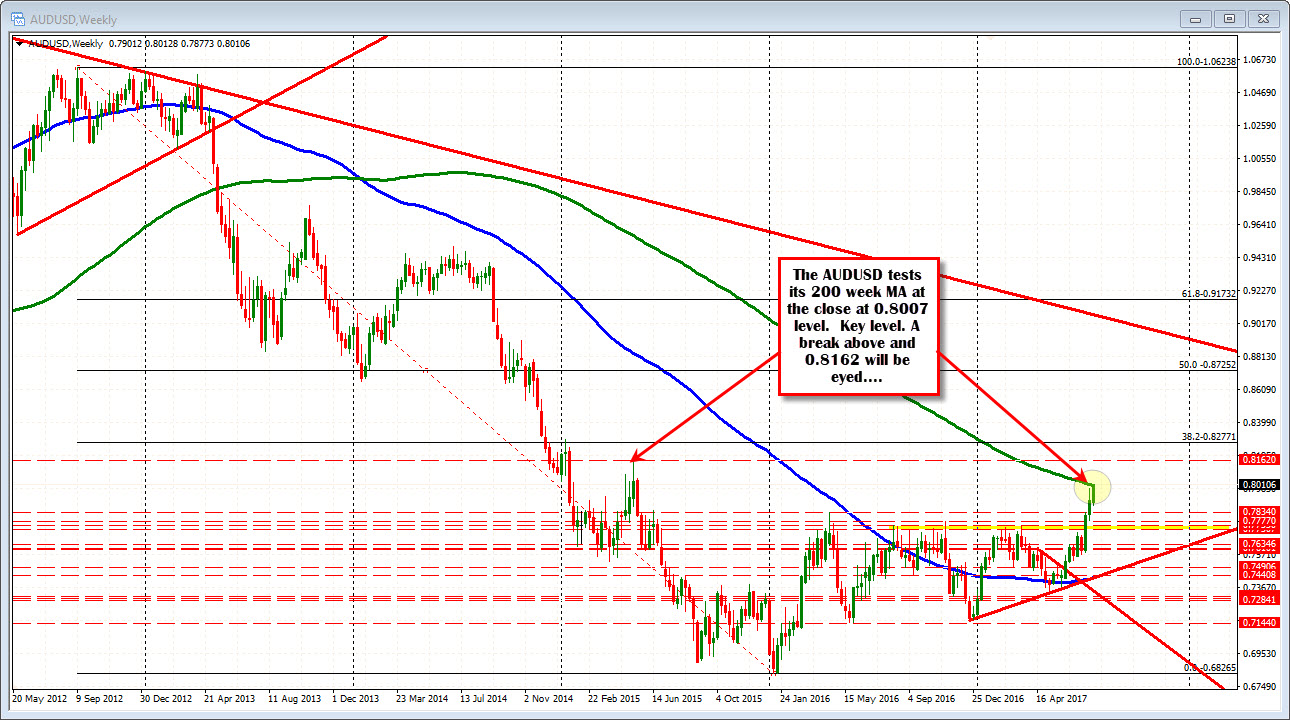
The AUDUSD is testing a key level at its 200 week MA at 0.8007. The high reached 0.8012. The pair closed the day at 0.80028. Key level going into the new trading day. A break and 0.8162 will be eyed.
Below are the percentage changes of the major pairs vs each other.