
If an earlier post today I commented how the price was following the technical clues. Since then, the market has continued to follow the technical clues – albeit in contained market trading.
We know by now that the the 61.8% of the 2012 high to low range held. Check
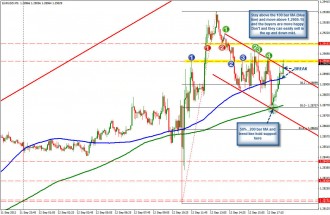
The move down tested the 100 bar MA on the 5 minute chart and the 38.2% of the days range. Check.
The subsequent rally off the support moved to the 1.2905-15 resistance area and found sellers. The buyers and sellers are more balanced. Check.
The fall from the failure to the topside, pushed below the prior support but found intraday buyers against the 50% of the days range, trend line support and 200 bar MA on the 5 minute chart. Check.
Now the price is back above the 100 bar MA and breaking above the trend line. The buyers against support below have the upper hand. They will be looking for a break of the 1.2905-15 area to confirm the upside. A failure to do so (or a move back below the 100 bar MA – blue line) and we will likely see the sellers reemerge.
It is an up and down day in NY trading but the technical levels seem to be catching the traders interest as risk can be defined. Risk can be limited.

