US PCE/income and spending data now out 29 Jan
- yy core 1.5% vs 1.5% exp
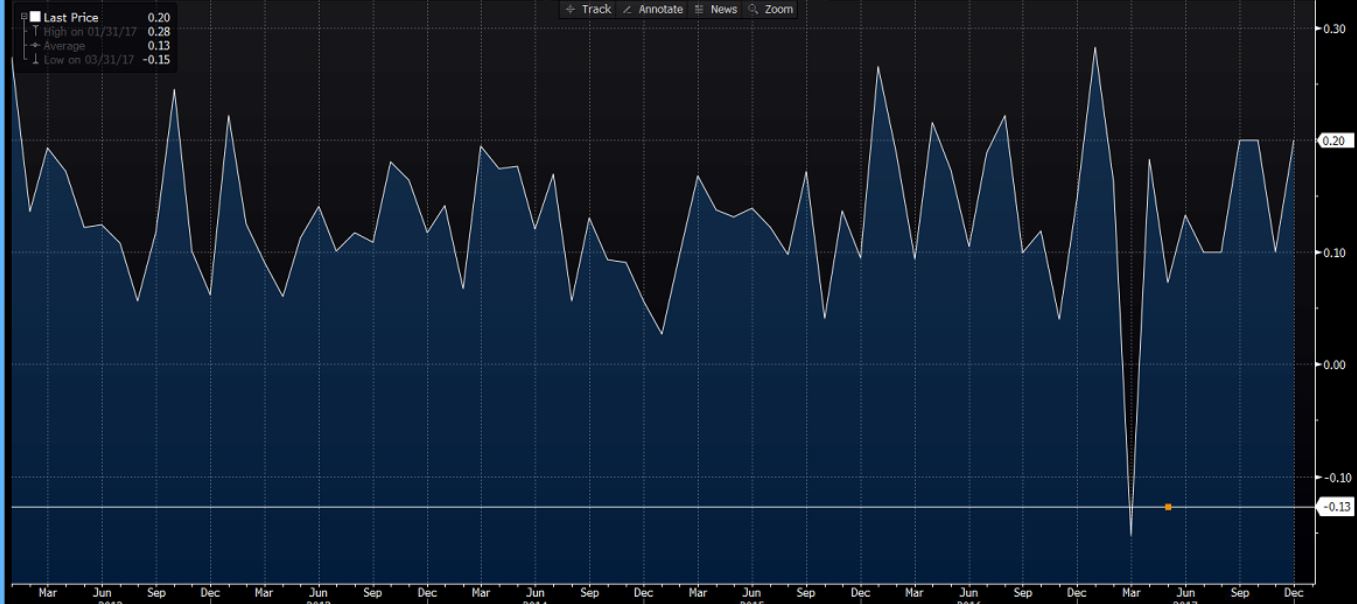
- PCE deflator mm 0.1% vs 0.1% exp vs prev 0.2%
- PCE deflator yy 1.7% vs est 1.7% vs prev 1.8%
- personal income 0.4% vs 0.3% exp/prev
- spending 0.4% vs 0.4% exp vs 0.8% prev revised up from 0.6%
Real Personal Spending 0.3% vs est 0.4% vs prev 0.5%
PCE in line but better income header and spending revision higher.
The Core Personal Consumption Expenditure released by the U S Bureau of Economic Analysis is an average amount of money that consumers spend in a month. "Core" excludes seasonally volatile products such as food and energy in order to capture an accurate calculation of the expenditure. It is a decent indicator of inflation.
Say the BEA:
- Personal income increased $58.7 billion (0.4 percent) in December
- disposable personal income (DPI) increased $48.0 billion (0.3 percent)
- personal consumption expenditures (PCE) increased $54.2 billion (0.4 percent).
- real DPI increased 0.2 percent in December and Real PCE increased 0.3 percent. The PCE price index increased 0.1 percent. Excluding food and energy, the PCE price index increased 0.2 percent.
Full report here
USD finding a few buyers but USDJPY and USDCHF still capped.