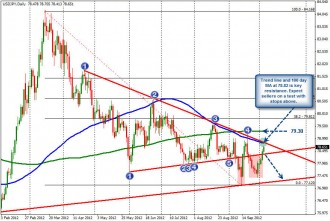
The 100 day MA and trend line resistance comes in at the 78.82 area. The price yesterday and today moved above – and held above – what was the old trend line support (at the 78.36 level – see daily chart above). This kept the bullish bias in tact and has helped the upside momentum today.
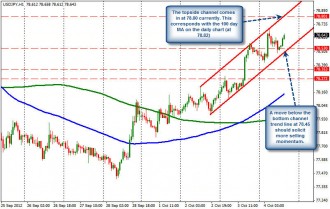
Looking at the hourly chart, the price is following a channel higher. The topside channel trend line was tested at the high today at the 78.70 level and corrected. The current channel levels below and above come in at 78.45 and 78.80 respectively. With the 100 day MA at the 78.82 level, look for profit takers against the level, with stops above.
The 200 day MA comes in at 79.30 (green line on the daily chart) and this would be the next key target to breach on a move higher.