The trend remains your friend...
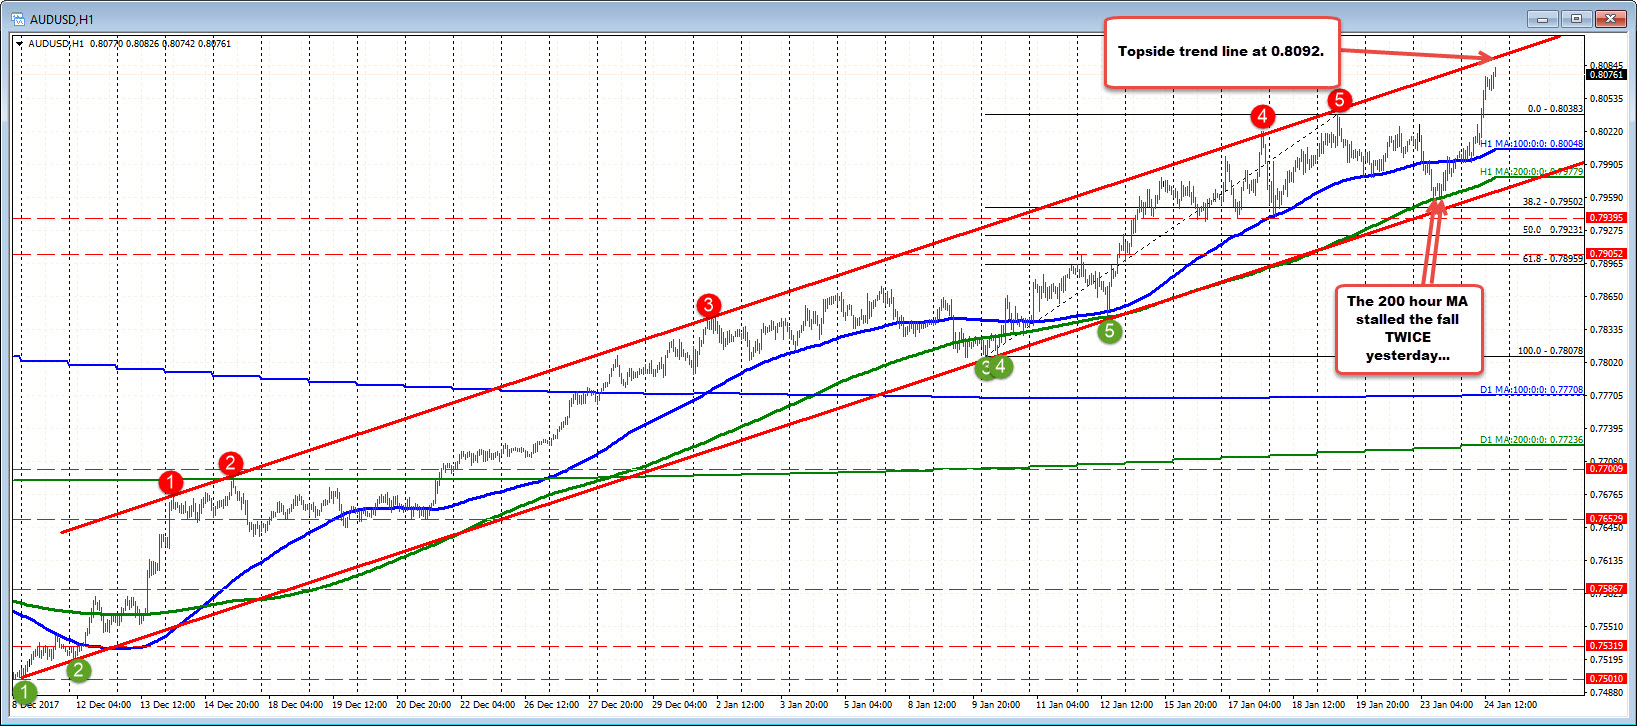
The AUDUSD has been in a LONG trend move since bottoming at 0.7502 in December. That move has done a good job using the channel trend lines on the hourly chart, and MAs as well (on corrections).
Yesterday, the pair stalled the fall twice at the 200 hour MA (green line). Today, the 100 hour MA (blue line) provided a base for the next move higher.
What now?
Well, the pair is approaching the rising topside trend line at 0.8092 on the USD weakness today. Last week, that trend line was tested twice and each time sellers leaned (red circle 4 and 5), and a modest correction followed.
The price high has reached 0.8082. Will the sellers lean on a test?
The technical history says it should be a level for a pause, but reading the above chart from left to right, the trend is your friend in this pair. So sellers will be cautiously putting a toe in the water.
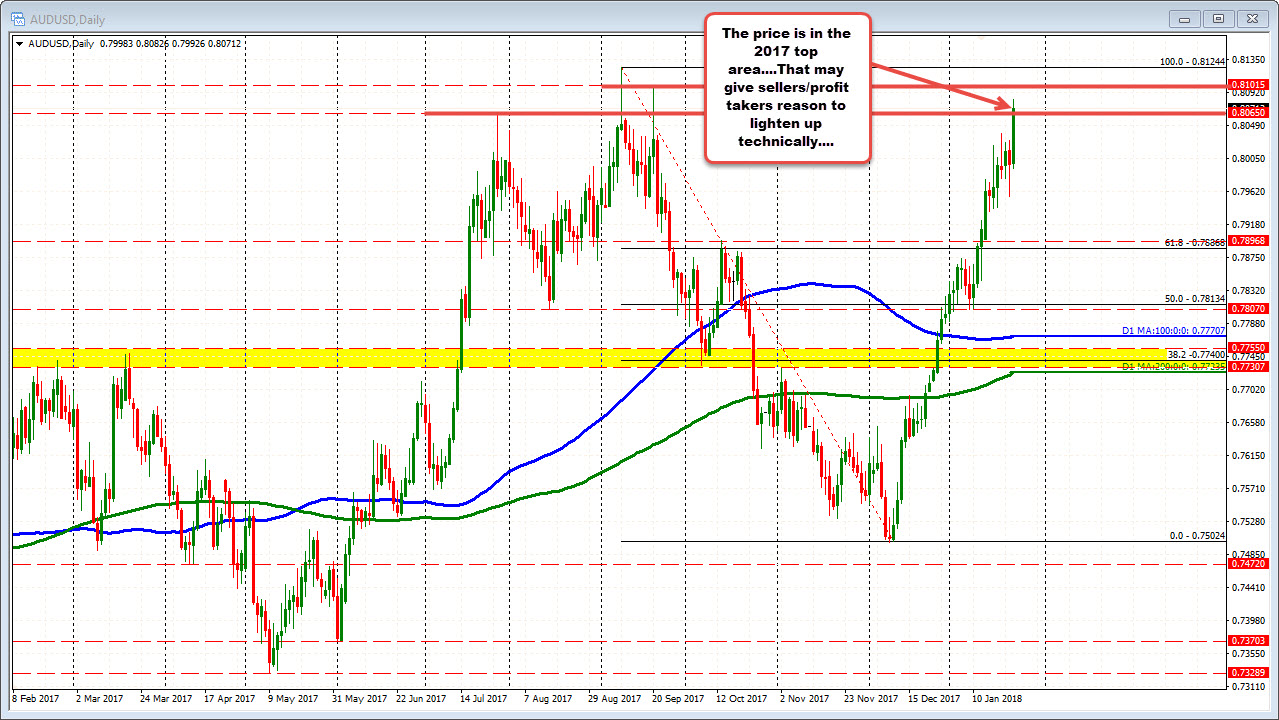
Helping the toe dips, might come from the daily chart.
Looking at that chart, the pair is near the highs from 2017. The last swing high came in at 0.81015. The highest high comes in at 0.81244. The 0.8065 was a swing high from July. Those swing highs (which were rejected quickly each time, may make it easier to stick that toe in the selling water.