
Runs 275 pips lower
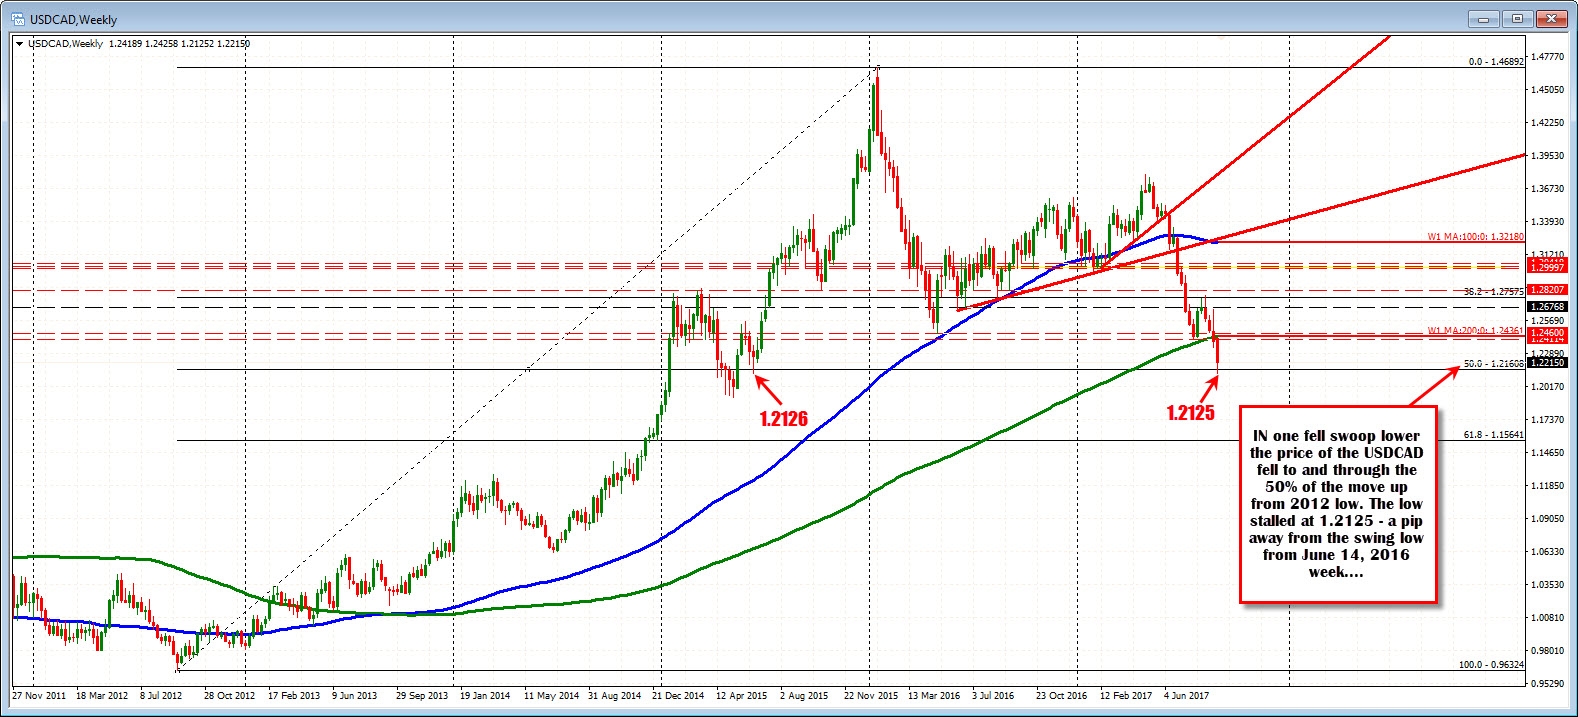
The BOC hiked rates by 25 basis points and the USDCAD tumbled. The move on my chart fell about 275 pips lower. That took out the 50% retracement of the move up from the September 2012 low at the 1.21608 and bottomed at 1.2125 (what was your low?). That low was about the low from the June 14, 2015 swing low. Wow....We currently trade above that 50% level at 1.2192 on the bounce.
What now?
On a run like this, expect more volatility. There were likely stops that were triggered from above., that were filled at much lower levels than traders expected. So traders may have sold into the low.
That is ok if the price action stays contained. However, if the shorts at the lows get angry, they can force a short covering rally too. Remember as well that the net speculative position has been long CAD. So if traders want to take profit that too can cause a rebound.
For me, a proxy for "staying contained" is the 50% of the trend move lower (in this case). That comes in at 1.22698 currently (see chart below). The high corrective price on the minute chart below has stalled at 1.2250. So far, the price action is contained.
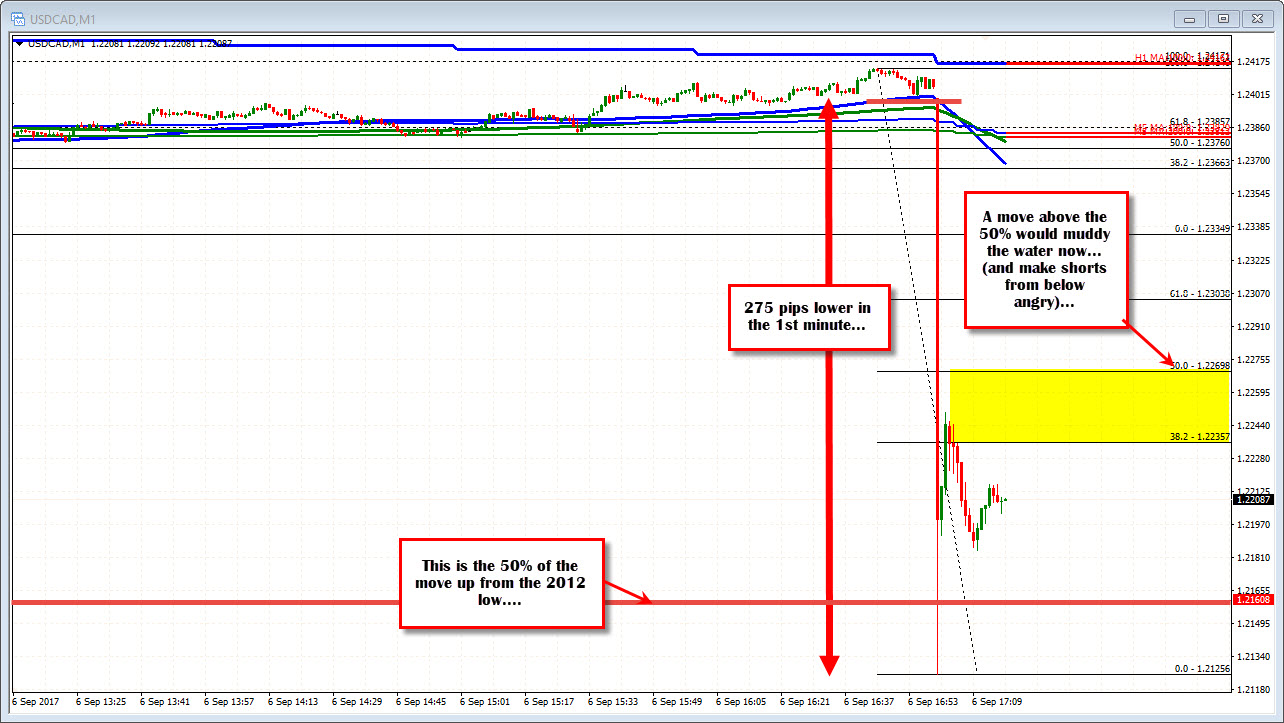
Overall, the pair is in open road. The price is moving away from the 200 week MA (green line on the weekly chart) and trades at multi year low levels. However, I did not expect the fall to be so dramatic in the first minute. That may have gotten some traders offsides (sellers at the lows). The 1.21608 level (50% retracemennt on the weekly) remains a target to get and stay below now for sellers. On the topside, the 50% retracement of the move lower at 1.22698 is a resistance level to stay below. A move above could muddy the water a bit for buyers and sellers.

