
Not been below that MA since January 11th.
The last two weeks, tested longer term resistance at the 38.2% of the move down from the 2008 high and the 100 month MA at 1.2516 and 1.2548 respectively. The highs reached between those levels each week. Sellers kept a lid on the pair (see may weekend education post for more talk on that key level).
Drilling to the hourly chart today, the price high could only get to 1.24744 (after opening lower and bouncing).
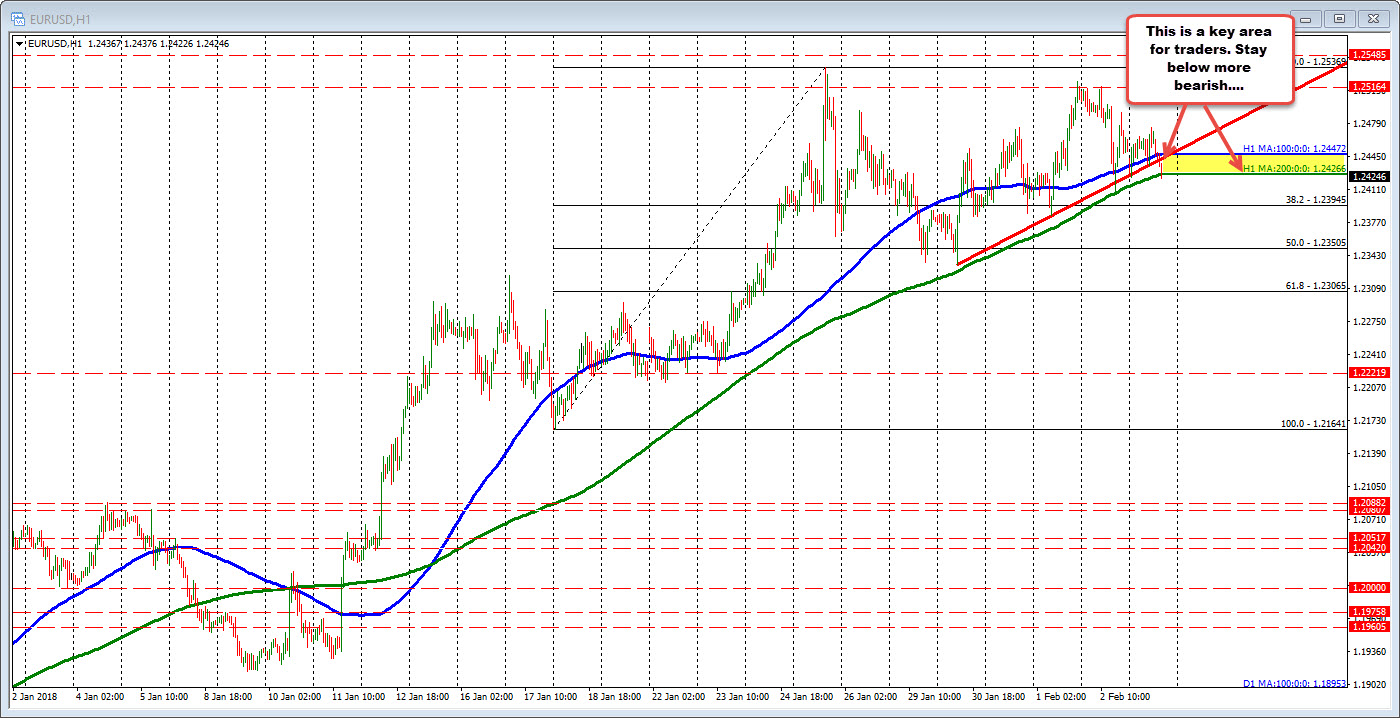
We care currently testing (and moving below as I type) the pairs 200 hour MA at 1.24266 (green line in the chart above).
On Friday that MA was tested, held and rallied higher. We are back down retesting that MA line. Key level for buyers and sellers. The price has not traded/closed below that MA since January 11th.
The 100 hour MA is up at 1.2447. That is a risk level for shorts looking for more selling. If the sellers are to keep firm control, staying below that level would keep the sellers near the highs, content. A move above, muddies those bearish feelings.
On more momentum, the 38.2% of the last trend leg higher from the Jan 18 low comes in at 1.23945. The 50% of that move comes in at 1.23505. The swing low from January 30 came in at 1.23339.

