100 day MA above. 50% and a bunch of swing levels below.
The AUDUSD will be influenced by the 3Q CPI data released later in the day (0030 GMT). The expectations are for a 0.5% increase with YoY coming in at 2.0% (see estimates here).
Technically, the pair has positioned itself between some key technical levels.
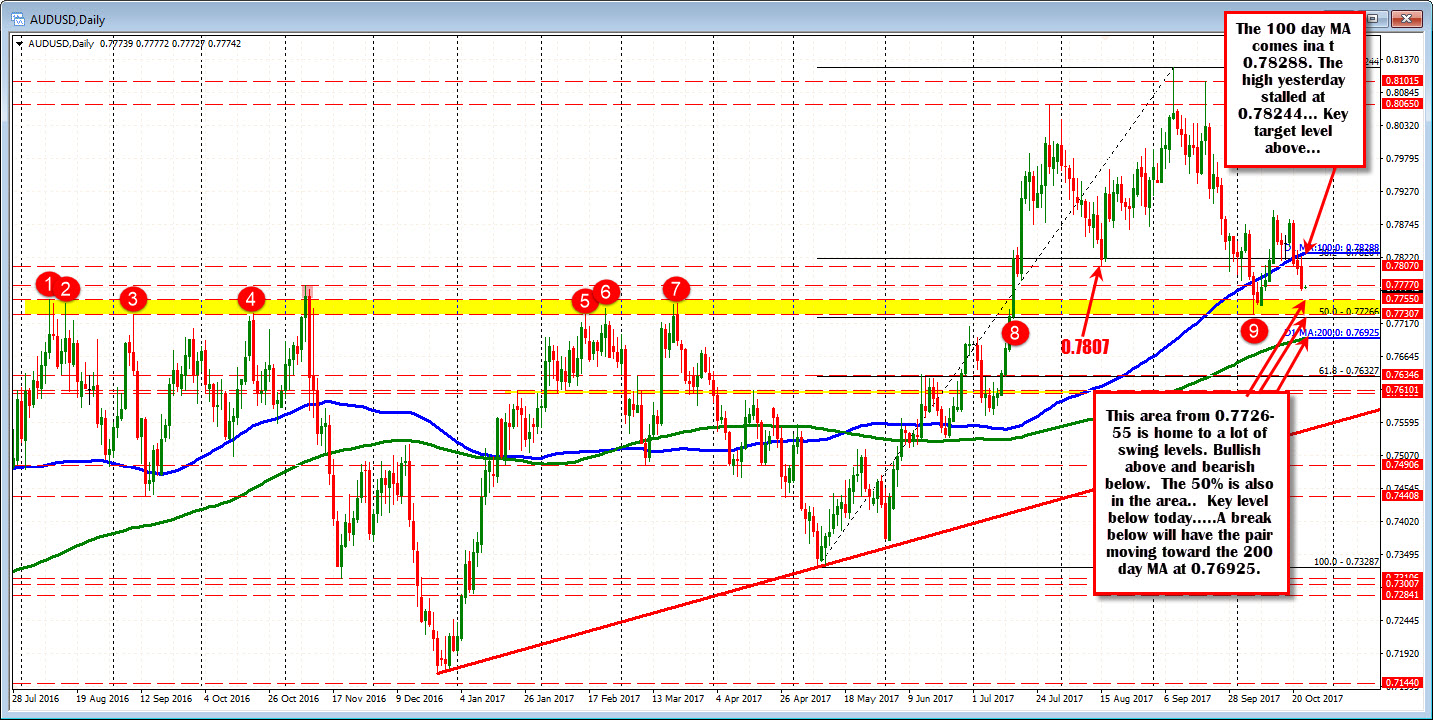
Looking at the daily chart, the price fell below the 100 day MA at the end of last week and has been able to close the last 3 trading days below that key bias barometer. That MA comes in at 0.78288 today. The high price yesterday tested that MA line (high reached 0.78244). Sellers were leaning and the price rotated lower.
On the downside, the October low from earlier in the month stalled at a low price of 0.7732. The 50% of the move up from the swing low in May comes in at 0.77266. So like the 100 day MA, buyers earlier in the month leaned against that support level.
Also near the lows are a number of swing levels going back to August 2016. Looking at the 0.77307 to 0.7755 area, there have been about 9 swing highs/lows (including the low from earlier this month).
So if the 100 day MA is a barometer for bullish and bearish above, the 0.77266-55 area is another - wider - barometer for bullish above, and bearish below.
Of course, the number is going to dictate the price action. With the expectations coming in at 2.0% (the low of the 2-3% target for the RBA), the market will be disappointed if the YoY figures are below the 2.0% level.
If below that level, expect that 0.77266 low "line in the sand" to be tested. If broken, look for a continuation toward the 200 day MA at 0.76925. Of course the lower the inflation numbers the better chance that 200 day AM is busted.
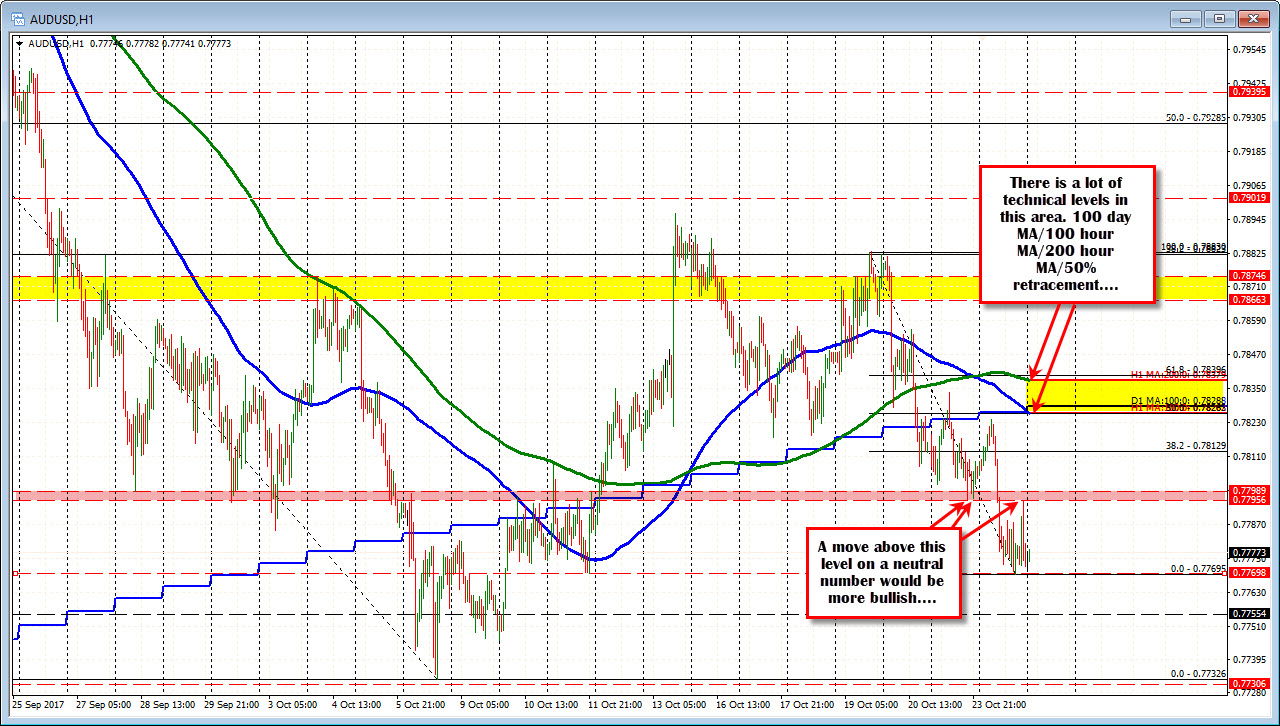
If the number surprises to the upside (say 2.2% or higher), I would not be surprised to see the market move up to test the 100 day MA without much trouble A break above would open up the upside for further momentum (toward the October highs at 0.7883 and 0.7896 (swing highs from October) over time. On a break of the 100 day MA the resistance will become support (PS the 100 hour MA is also currently at the 100 day MA level (see hourly chart below). That is a key technical level. .
What if things come in as expected?
If the market price rallies (we are near a lower level), watch the 0.7795-0.7800 area. Looking at the hourly chart, the area stalled the fall yesterday. The price today fell below the level but corrected up to retest the level in the NY afternoon session (see hourly chart below). A move above could still see the buyers squeeze up toward the 100 day MA/100 hour MA at 0.78288. A move above that could see a test of 0.7839 (200 hour MA -green line in the chart below) but that area (100 day/100 hour/200 hour MAs) should be a tough nut to crack. Look for sellers to line up on the first test.