
Last week closed above key MA, but not by much
Last week, the NZDUSD moved higher and in the process, moved above the
- 2017 high at 0.7374,
- the November 2016 high at 0.7402, and
- above the 200 week MA at 0.7428.
The pair closed above all those levels at 0.7453.
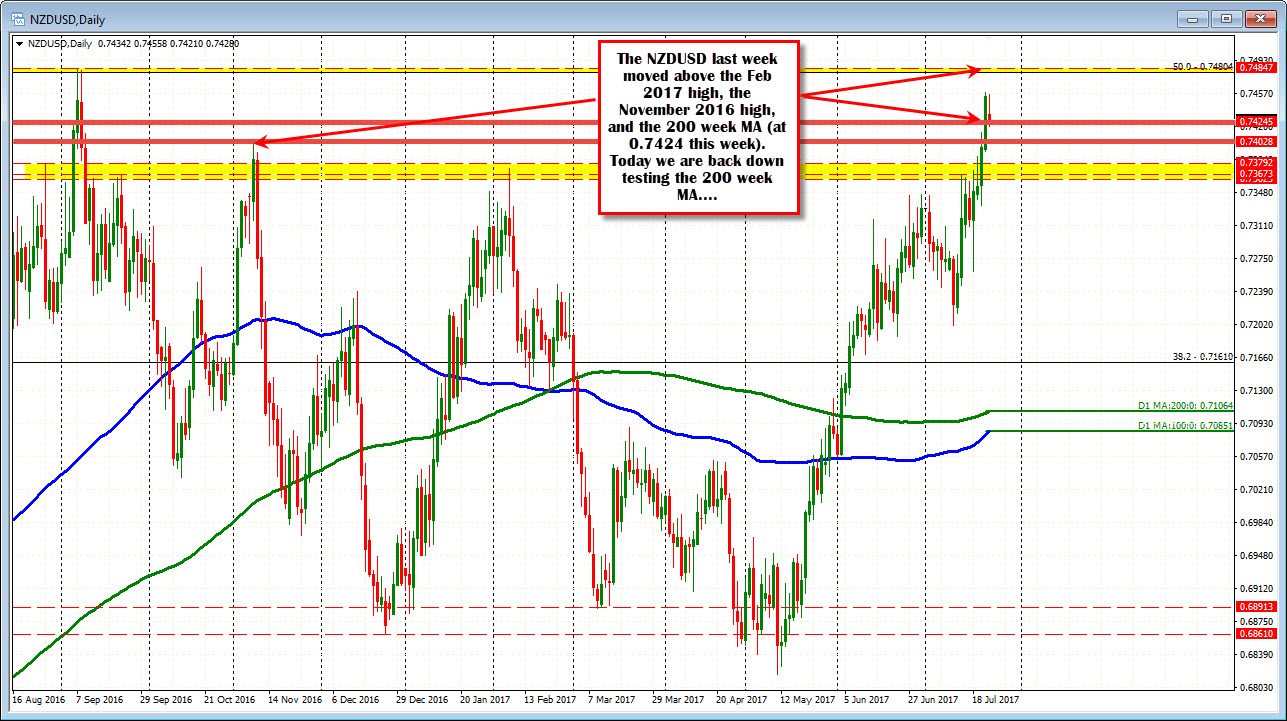
On the topside, the high from August 2016 comes in at 0.74847. The 50% of the move down from 2014 high to the 2015 low (the lowest low) comes in at 0.74804 - right around the August 2016 high.
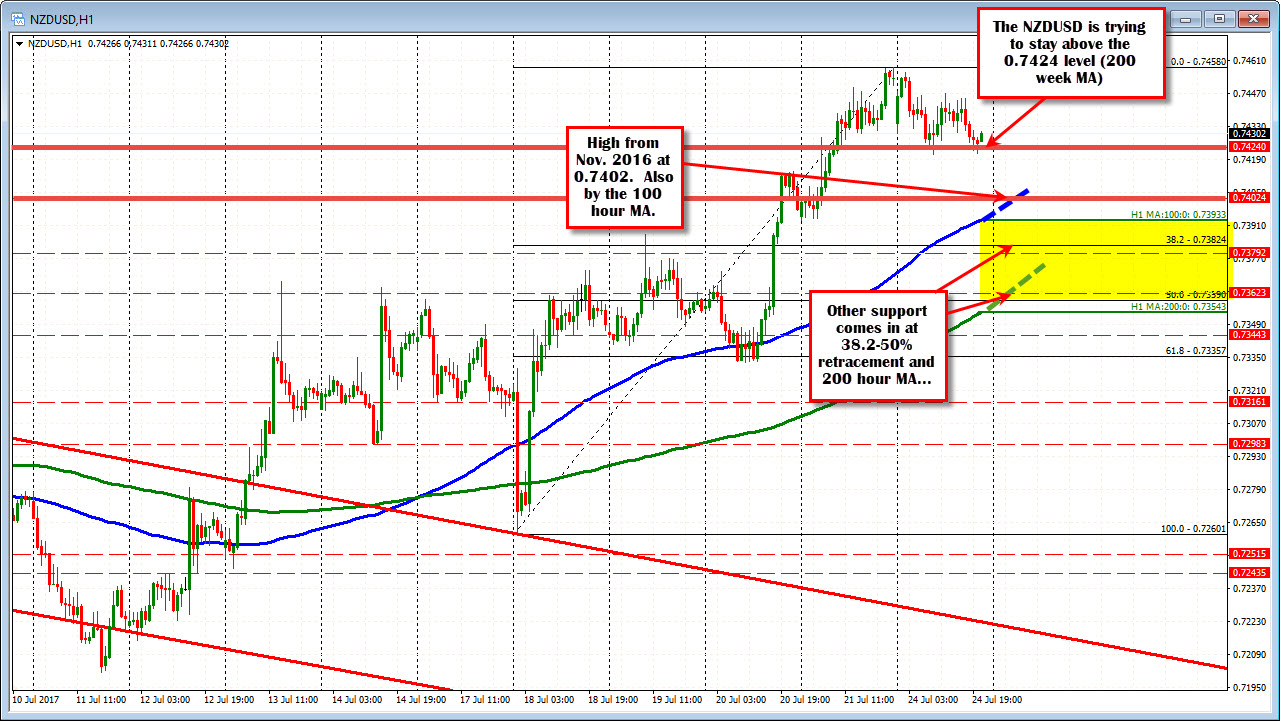
This week, the 200 week MA comes in at 0.7424. The low today has so far reached 0.7421 - twice (see hourly chart below). Traders are trying to lean against the broken MA level and base for the next run to the 0.7480-847 area. If the upside move restarts, I would expect that area to be a tough nut to crack.
Can the 200 week MA hold? That is what trading is going to be about in the near term.
What happens on a break lower? The market will likely be disappointed about the failed break of the longer term MA. However, there remains other support down below that will need to be broken to get things going:
They include:
- 0.7400-02. The high from November 2016
- 0.7393. The current 100 hour MA. That MA is moving closer to the 0.7400-02 area
- 0.7362-79 area. This is home to other swing highs on the daily chart. The 200 hour MA is moving closer to this area as well (currently at 0.7354).
SUMMARY: The buyers took control of the NZDUSD and continued the push higher in the pair. Today, the price has corrected lower and back to test the 200 week MA at 0.7424. This is a key test for the buyers. Pass, the test and we should move toward key resistance above at 0.7480-847. Move below and there should be a retest of broken levels.

