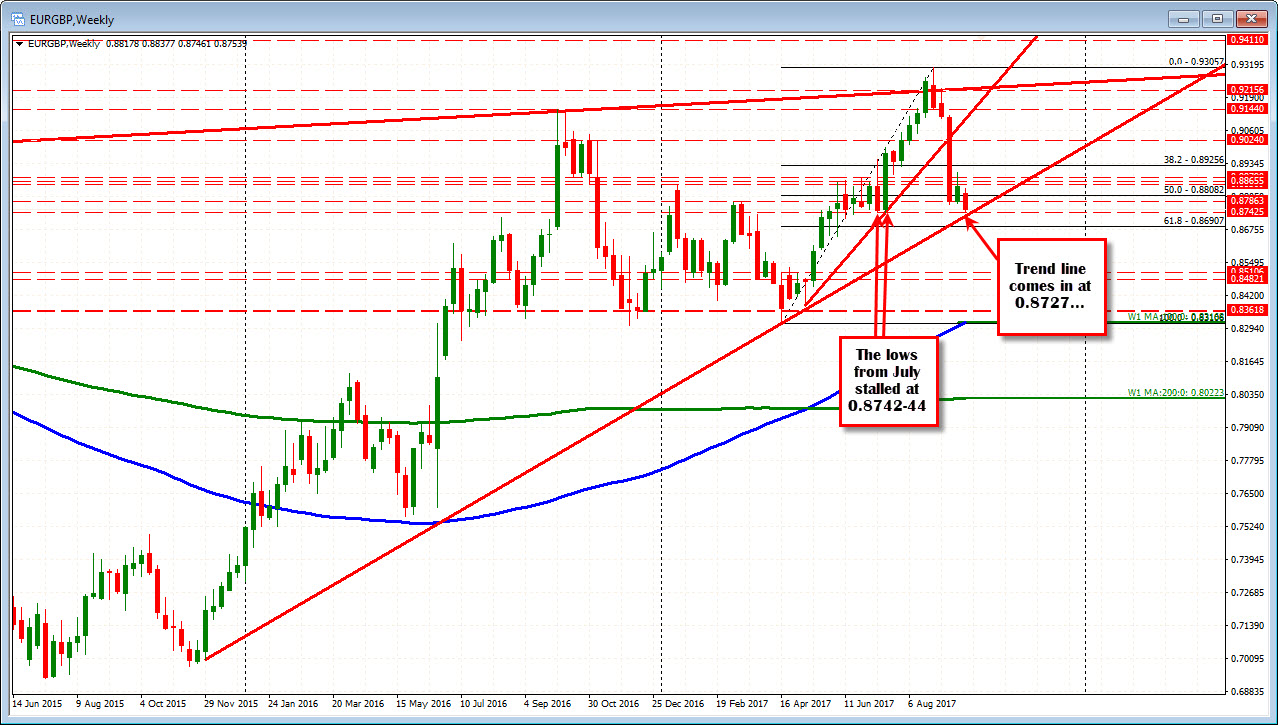
Trend line and swing lows
The EURGBP has reached new lows since July and in the process is approaching swing lows from June to July. Those lows stalled at 0.8733-44. In addition, a trend line from November 2016 cuts across at 0.8727. The low today has reached 0.8746 so far. We trade at 0.8755 currently.
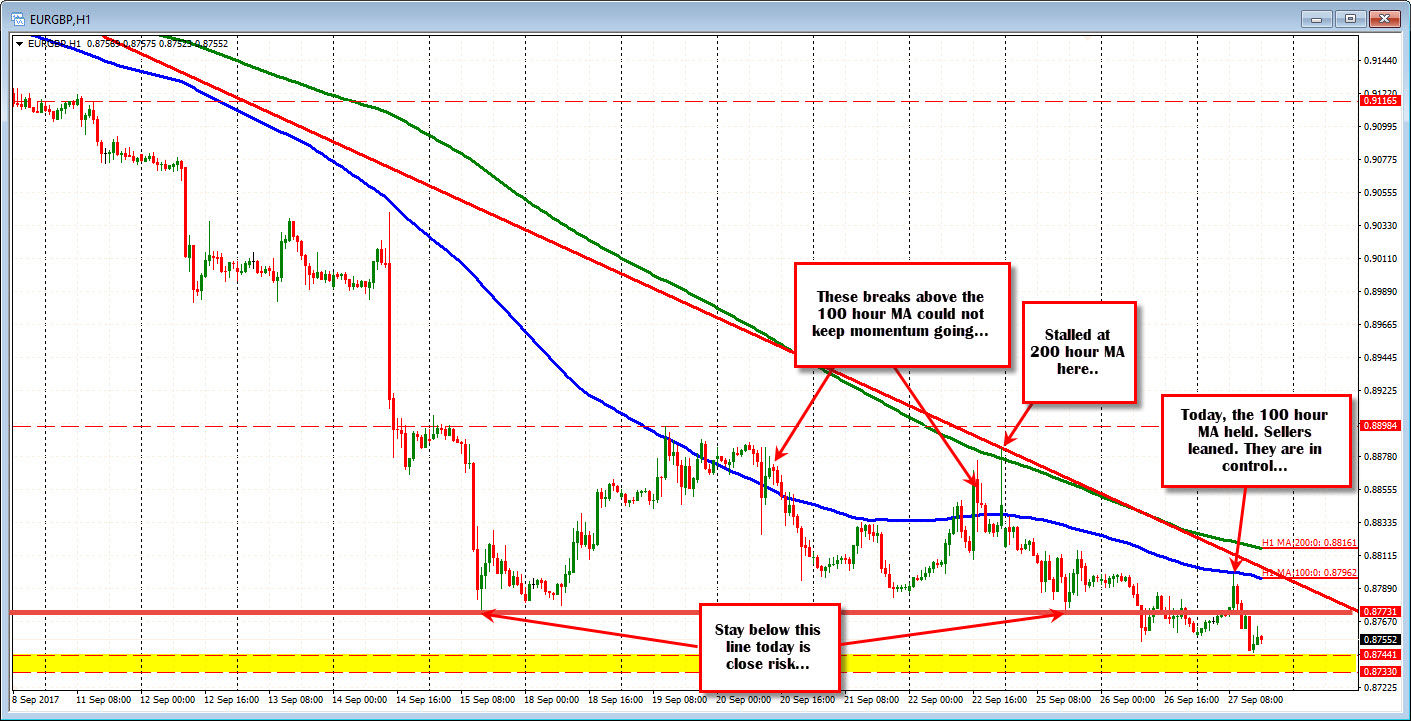
What favored/favors the downside today was that the corrective move higher today, stalled right below the 100 hour MA (blue line in the chart below). Sellers leaned against the MA level and the market has been stepping down in the London session. That is a risk level for shorts now.
A closer risk level for sellers looking for more downside comes in against the 0.8773 level. That was a swing low form Sept 15 and Sept 25. The last two days has been trading above and below the level BUT, the last 6 hours has stayed below that level. Is the market lowering the ceiling - under the 100 hour MA now? Could be.
The key though for shorts now is to get below those levels from the weekly chart. So there is a battle that is heating up between some longer term support below and some shorter term technical resistance above. Be aware.
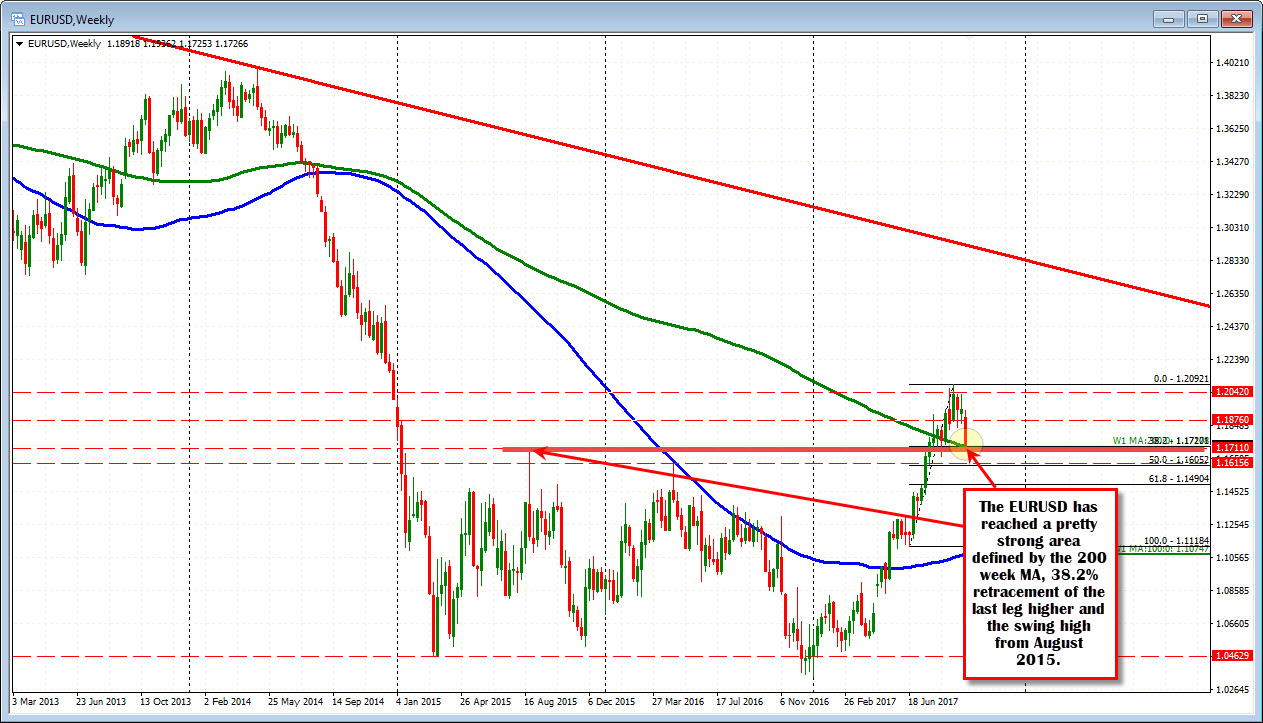
PS. the EURUSD is testing a key support area defined by the 200 week MA, the 38.2% and swing high from 2015 at 1.1711. I outlined this level in the weekend video as a key support target (CLICK HERE). A break below could trigger stops and in the process influence the EURGBP. So far though the level is stalling the fall (cause for pause).