
Back above after failing to push lower in early trade
The 100 day MA has been broken and failed and re-broken and failed over the last three trading days. That MA comes in today at 1.3088.
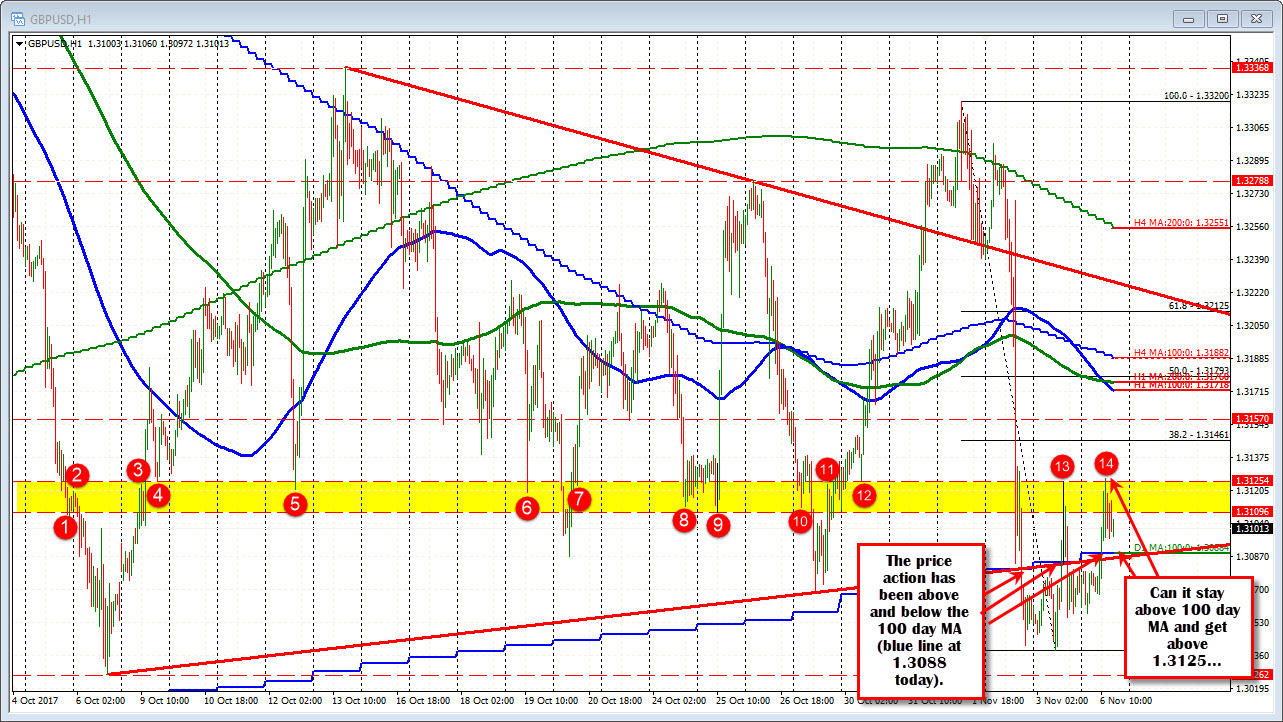
Today the price tried to stay below the MA line, but once the price moved back above, the sellers turned to buyers. You can see the price action around the 100 day MA on the hourly chart above.
Also on the chart, there is a number of swing levels in the 1.3110-25 area. The swing high on Friday and again today peak around the upper end of that extreme (the high today reached 1.31266 but could not keep the momentum going).
We trade above and below 1.3100 now with the 100 day MA at 1.3088 and the top of the swing area at 1.3125. The up and down around the 100 day MA and the stall at the 1.3125 area suggests that the market is looking for that catalyst push one way or the other.
Which way will it be? Right now activity is very quiet.

