
Midpoint of move up from August 2015 low comes in at 0.68423
The downside momentum in the NZDUSD is continuing in trading today. The move has the price testing the midpoint of the move up from the August 2015 low at 0.6842. The current price is trading right around that level. Key tipping point.
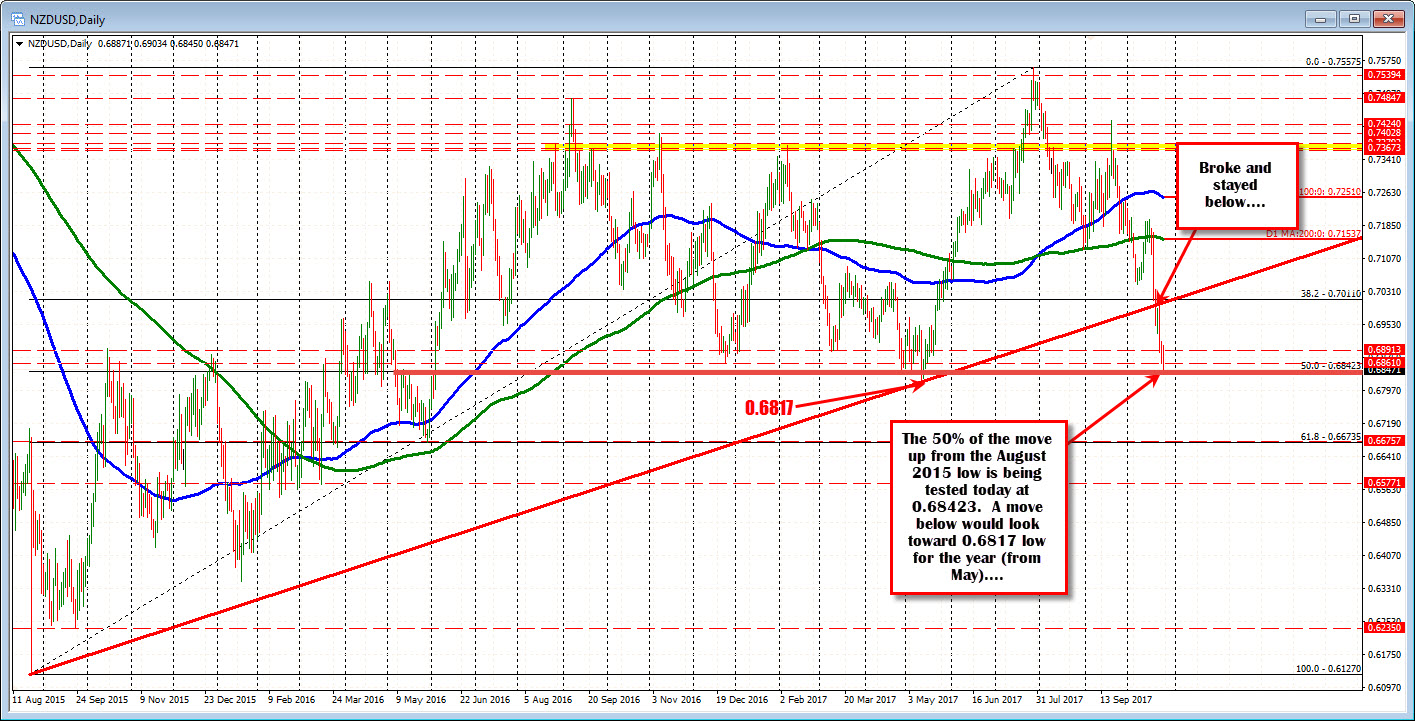
Back in May, the price fell below the level but that was not the midpoint at the time. There was a higher high in July that set the level. The low in May reached 0.6817 and that will be a target on a break.
Drilling to the hourly chart, there is a lower trend line that connects recent lows. It cuts across at 0.6835. Keep an eye on that level as well.
So key support in the NZDUSD being tested. A break opens the door for a run to the 2017 low. A break of that and the door opens for more downside.
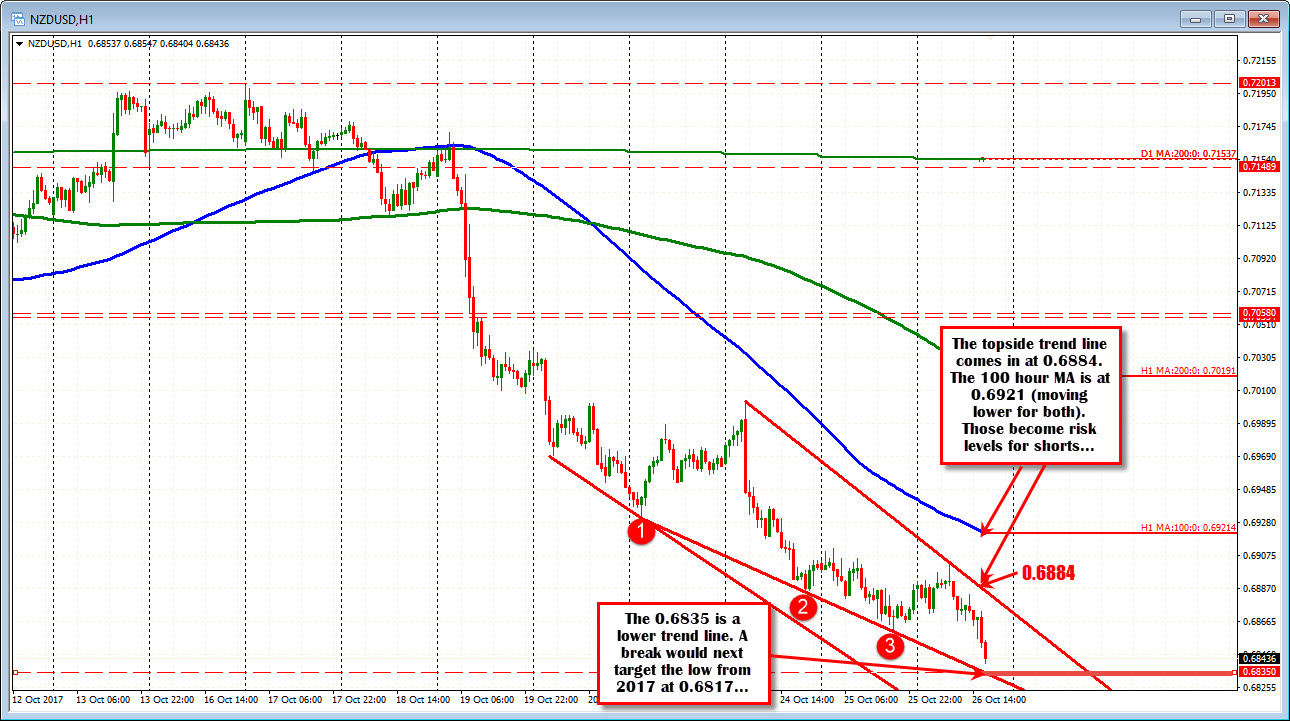
Picking a bottom in the NZDUSD is like catching a falling knife. There is little in the way of bullish clues. However, the area at 0.6835-42 is a target for shorts. Do buyers come in and correct? If they do, they will need to prove they can take more control by getting back above 0.6884 and then the 100 hour MA at 0.69214 (both are moving lower). Not being able to do that, keeps the trend sellers still in control. So be sure to listen to the price action.

