
Trades in the October, November, December range
The USDCAD is continuing the move higher which started on Friday/Monday. On both those days, the price stalled near the 100 day MA (blue line at 1.26328 currently). That was a bullish signal. Yesterday, was the next step to further gains. The price moved above the 200 day MA and took off. The high stalled against an old swing high from August 2017, but today we are seeing more upside.
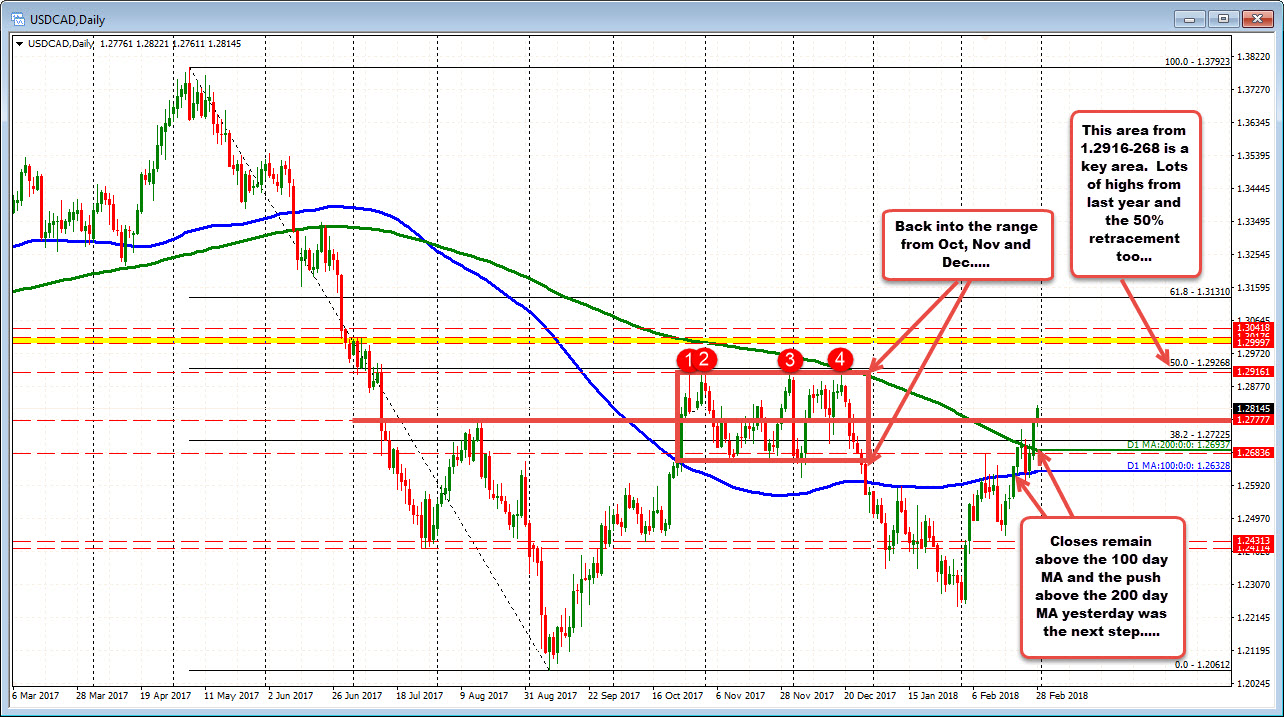
The pair trades in the middle of an up and down range from October, November and December. The high of that range saw the pair stall just short of the 50% retracement at 1.29268. There were 5 separate highs near that level (call it at 1.2916). The price is still 100 pips away from that area but it is the target on the bullish break (and will be a key level on a test. Be aware.
Drilling to the hourly chart below, the pair is trending higher Today's low was a swing high from yesterday. That is a good/bullish signal. The topside channel trend line comes in at 1.2838 (and moving higher). The 1.2785 is a lower trend line (and moving higher). That is close risk for longs now.
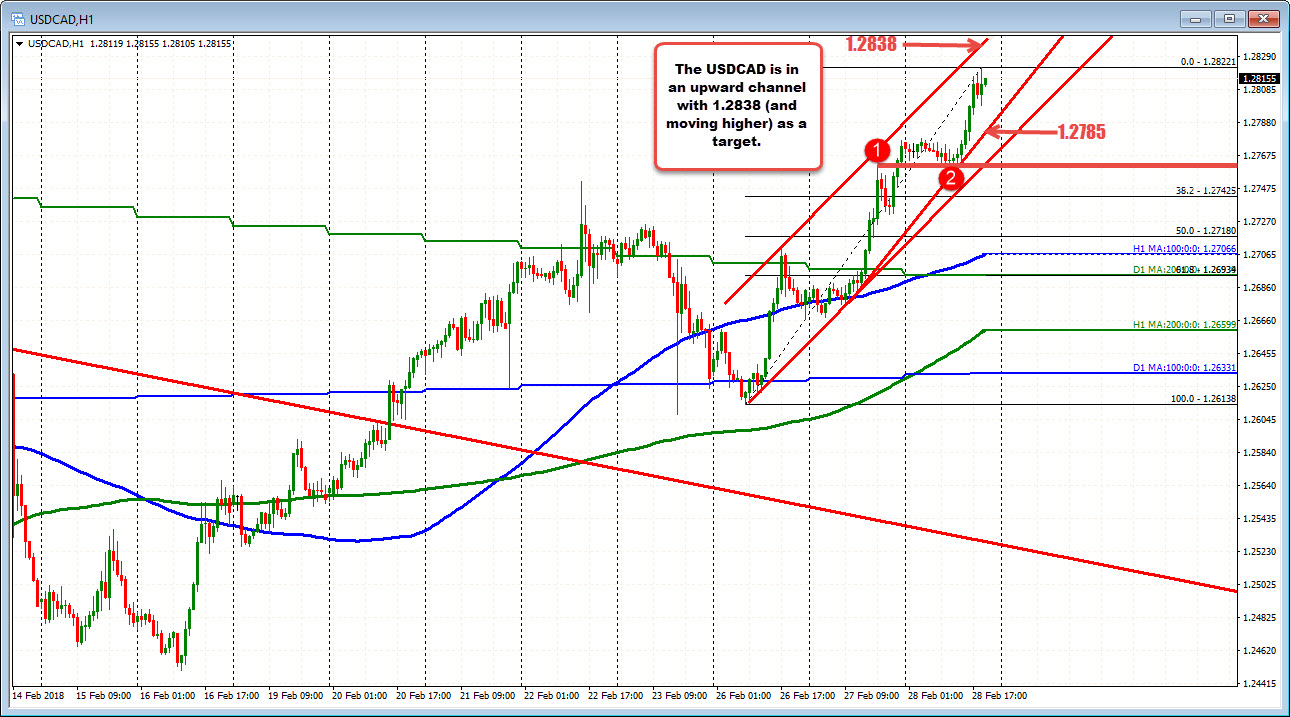
SUMMARY: Bulls are in charge. The pair is trending higher since bottoming last week/earlier this week. Levels are being broken with limited corrections.
The are upside targets to eye including a trend line on the hourly at 1.2838 and at the 1.2916-268 where the 50% on the daily and 5 separate highs stalled rallies in October, November and December 2017.

