
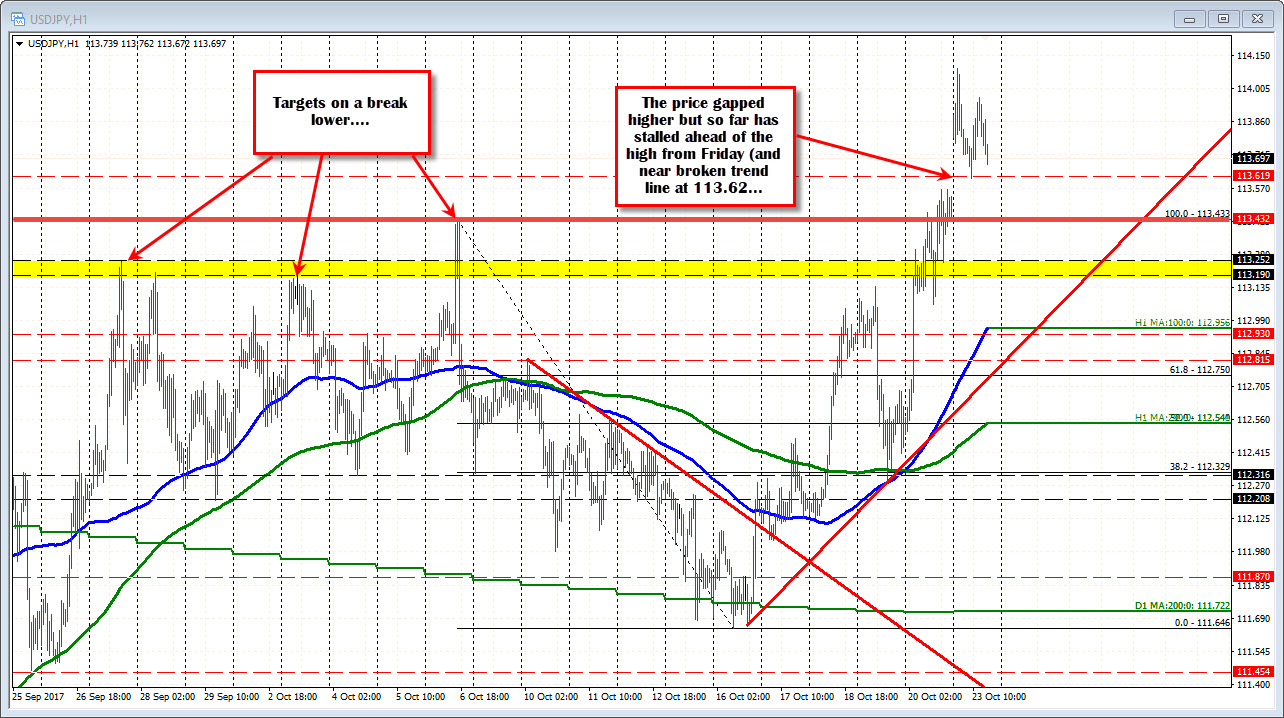
Trend line at 113.62
The USDJPY gapped above a topside trend line on the daily chart after the weekend and that gives the pair a more bullish bias. That trend line cuts across at 113.62.
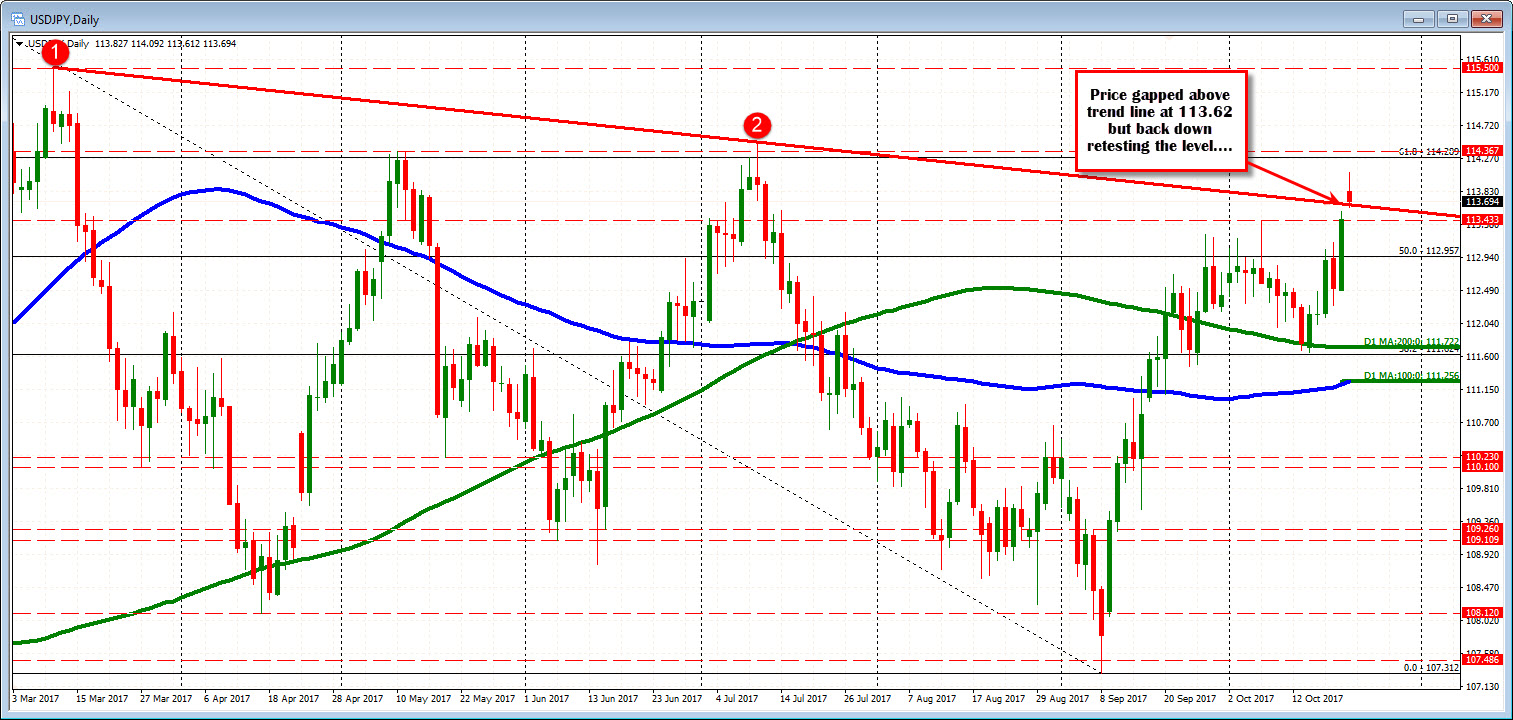
The price peaked at 114.09 before correcting lower (see chart below). The low came down to test that trend line (low stalled at 113.60) and rebounded. Traders leaned against the line and continue to leave a gap from the Friday high at 113.56. We currently trade at 113.74.
The price action has been up and down. I have to give the bias to the longs. However, a move below the trend line and there can be more selling on the break disappointment. The 113.43 is the high from October 6th. The 113.19-25 is other swing highs. They are downside targets on a break below the 113.62.
US yields are lower which typically hurts the USDJPY. The 2 year is down -1.6 bp. The 10 year is down -1.8 bp
The us stocks are giving up gains. The Nasdaq is the weakest at -13 points or -0.20%. The S&P is now unchanged.
Gold is still down which tends to support the USD a bit. It is down -$5.83 to 1274.60 but off the highs at 1280.72 (the low reached 1272.58).

