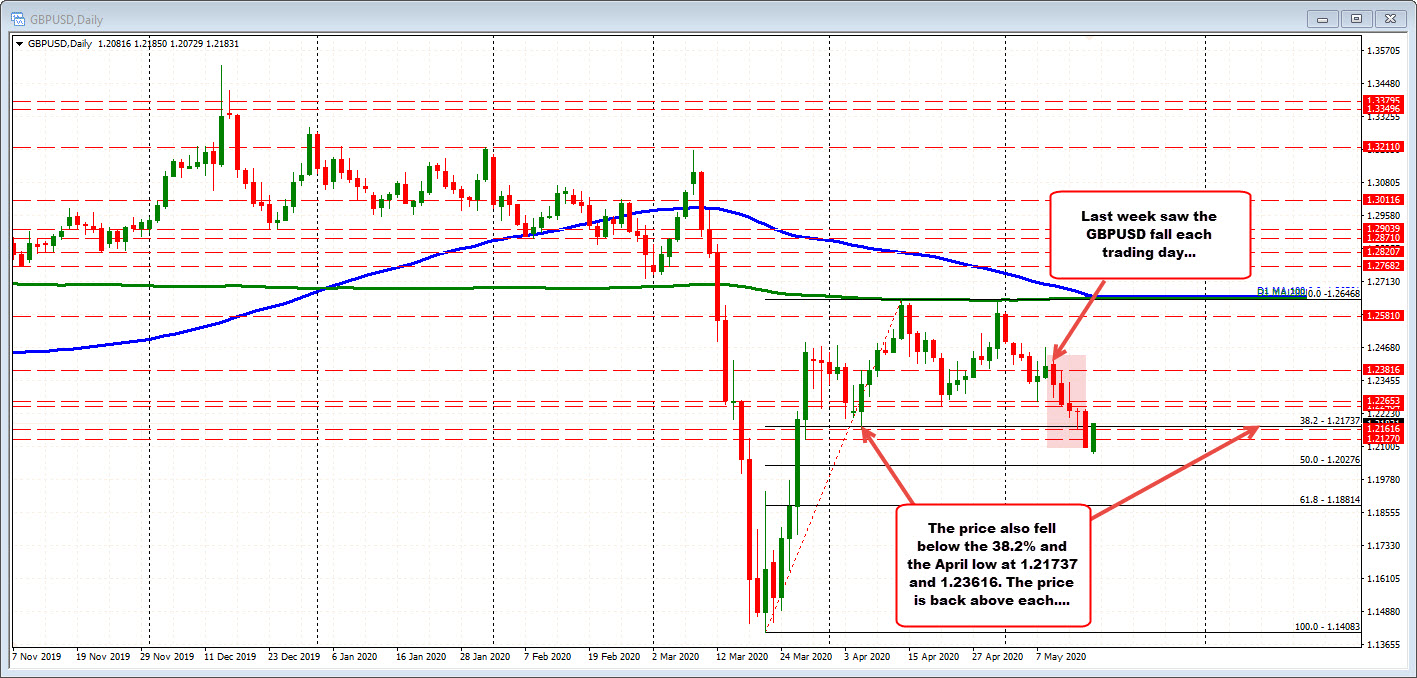
Last week, the pair was down 5 days in a row
The GBPUSD fell on each of the trading days last week. Concerns about Brexit progress reared it's ugly head once again and traders were not encouranged. The price moved below the 38.2% of the move up from the March low at 1.21737 and the recent swing low from April at 1.21616.
However, today the trend like move higher has taken the price back above the those broken levels. We currently trade at 1.2180. What was once a downside target, but broken is now support again. Traders looking for more upside will be eyeing those levels for bias clues (today and going forward).
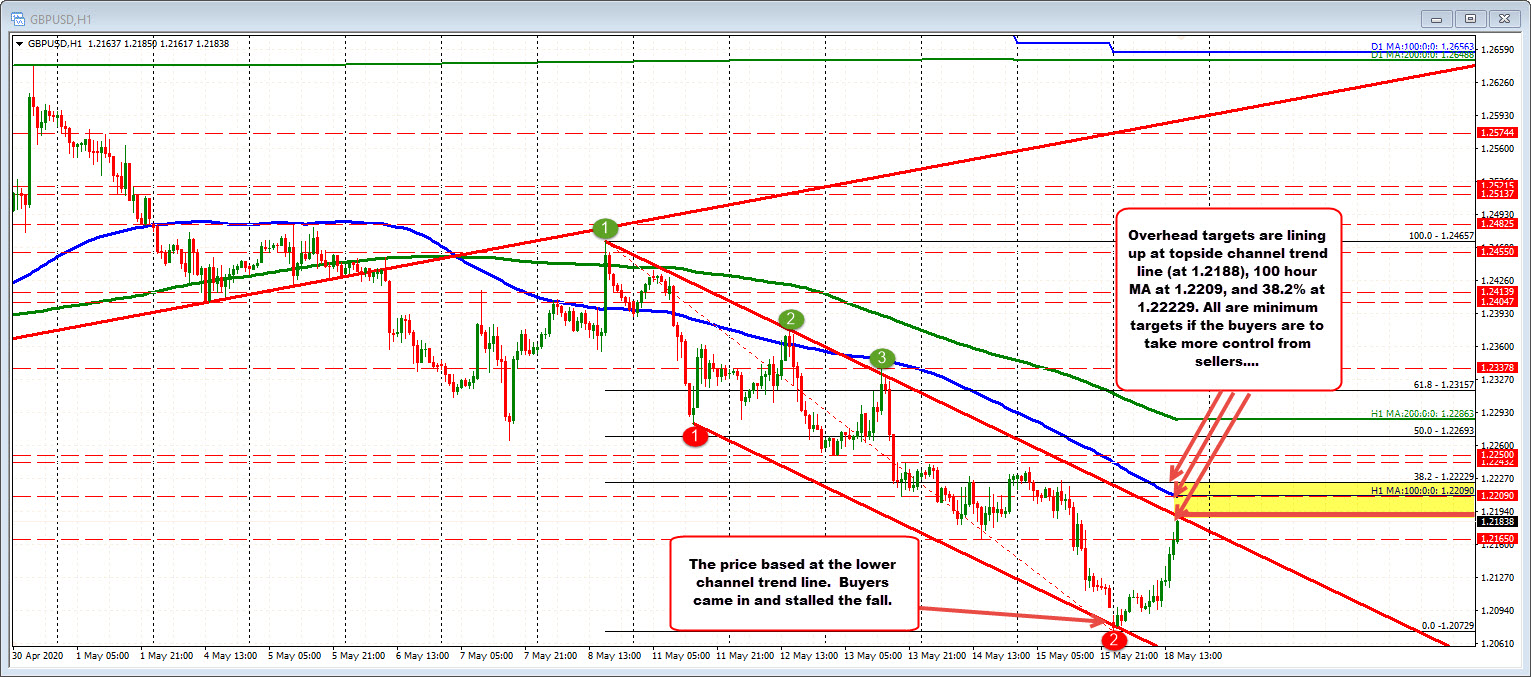
What stalled the fall?
Drilling down to the hourly chart, a channel trend line slowed the fall at the opening today. Basing against that trend line, helped to push the pair higher. That is the good news.
What may stall some of the euphoria is that the topside channel trend line cuts across at 1.2188. Above that is the 100 hour MA (last week the price took a look above on Tuesday, but it failed) at 1.2209. The 38.2% of the move down from the May 8 high comes in at 1.22229 level. All those are minimum objectives if the price not only basing, but is ready to go higher.