Market seasonal trading patterns for July
Last month I wrote about how the Australian dollar tends to outperform in June. It did just that as it gained 3.47% in the month to finish behind only CAD on the G10 scorecard.
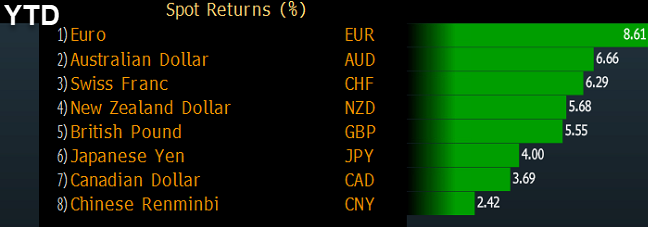
To continue the look back, here is how the FX market has performed so far this year. It's been a rough one for the US dollar as all the enthusiasm about tax cuts, infrastructure spending and rate hikes as faded.
Seasonally, July is not a big month in terms of patterns but a few stand out.
1) It's the start of a good period for bonds
July itself isn't notable for much, in any market but it marks the start of a few trends that last for months. One of those is strength in the bond market. Of the past decade, the July-Sept period has easily been the best time of year to buy bonds. Yields have been moving higher lately but the technical pictures show vulnerability.
2) Oil starts to slide
For the past few years I have written about how the late-year pattern of weakness tends to come earlier each year. A few years ago, the trade was to sell oil in September but that trade has crept forward and now the weakness starts in July. In the past three years, the July declines in WTI were 13.9%, 20.8% and 6.8%, respectively. I'm worried about the Middle East but if that's resolved, the latest bounce in crude will soon be a 'sell'.
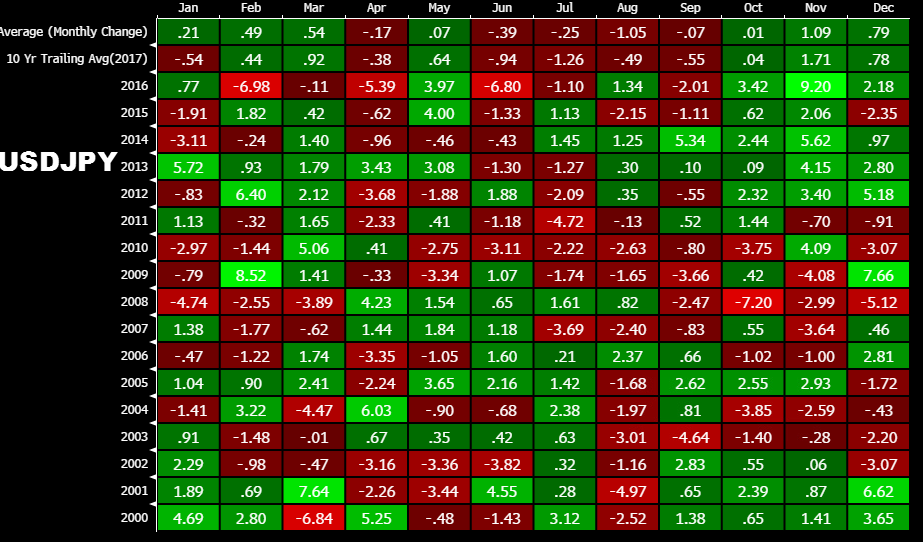
3) Yen strength
All these trades are counter-trend in the short term so that argues for patience and caution. The only standout trend in FX is yen strength in July. That dovetails nicely with seasonal patterns that show lower yields and higher volatility (which is counterintuitive in summer). Over the past decade, July has been the worst month for USD/JPY with an average decline of 1.26%.