
Ranges explode
When the North American traders entered for the day, the low to high trading ranges looked like this:
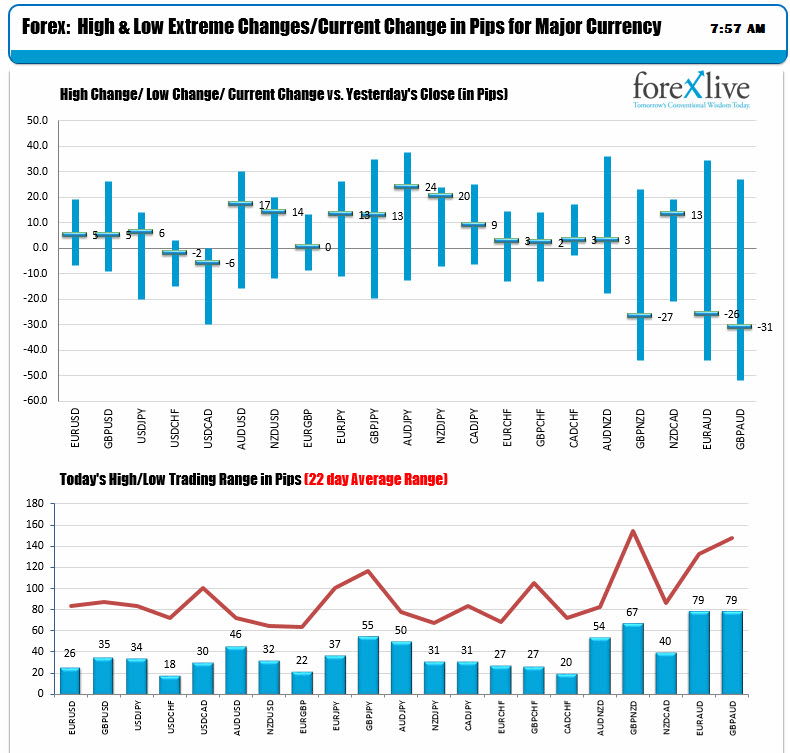
The red line represents the 22 day average trading range and all of the pairs were well below those ranges.
The US employment report came out and this is what it looks like now:
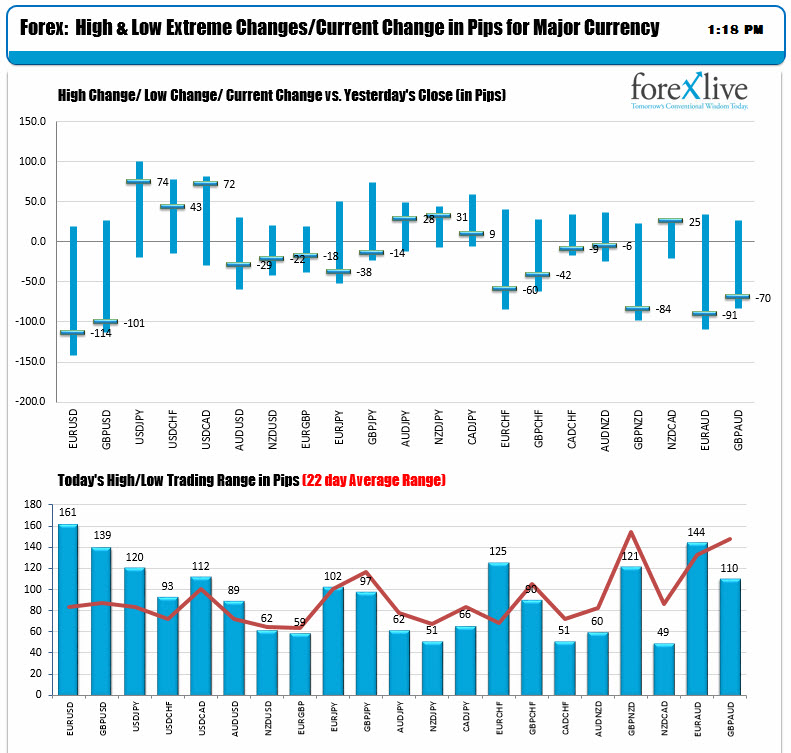
Most of the activity is focused on the USD but there was some action in the crosses as well.
How does the strongest and weakest rankings look now?
Before:
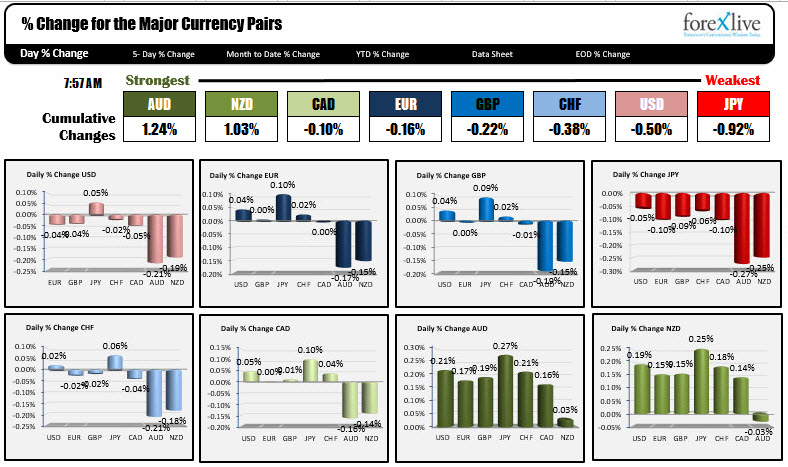
The USD was more down vs. up before the employment report.
After the employment report, the current snap shot shows a vastly different picture:
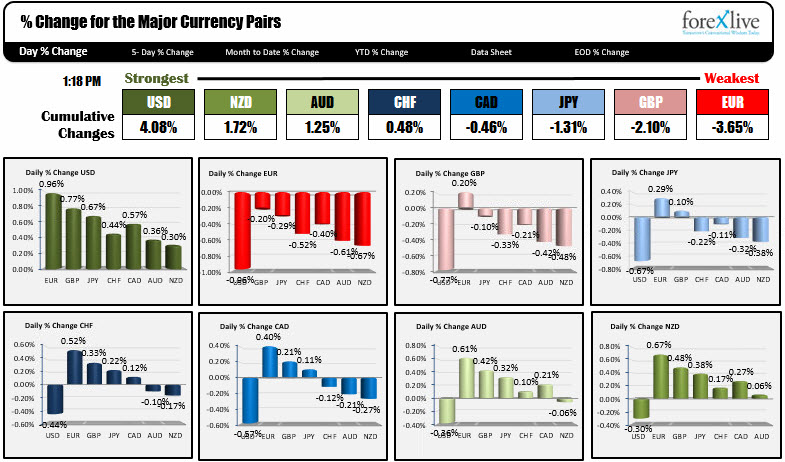
The USD is king for the day and it may be a prelude to more dollar strength going forward.
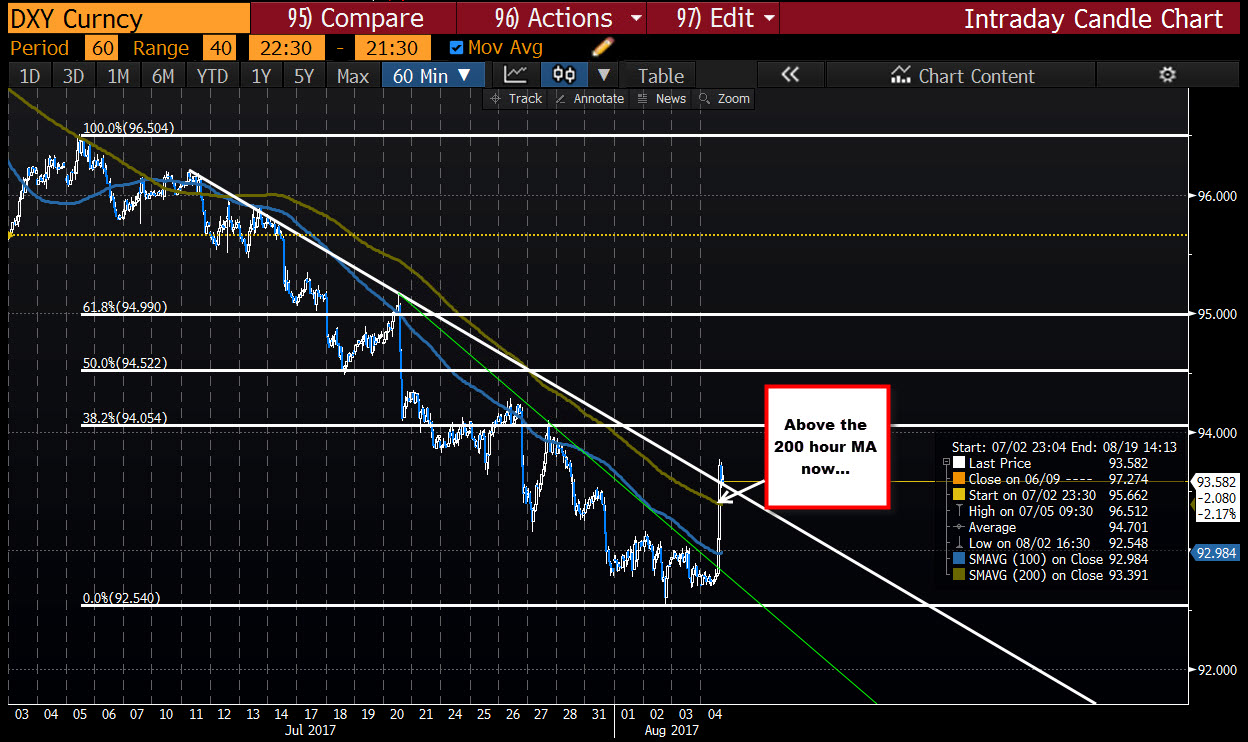
Below is the hourly chart of the Dollar index. The price today zoomed above both the 100 and 200 hour MAs at 92.984 and 93.39 respectively. The move above the 200 hour MA was the first move above since July 11th. Stay above going forward and there is more room for a corrective rally.
Below is what the dollar index looks like on the daily chart. It has been accelerating to the downside over the last 6 or so weeks, but the move higher today is one of the biggest up days in a long while.
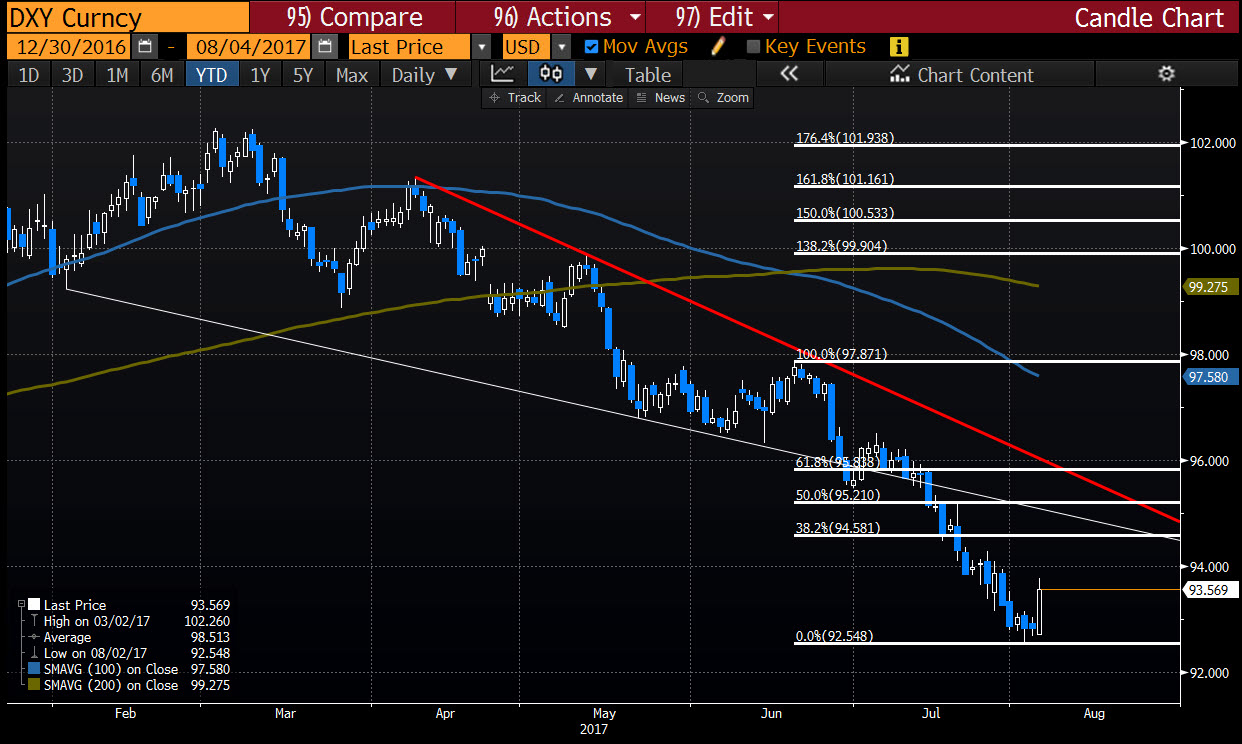
What a difference a report can make.
It could be that the move higher in the dollar may have made a bottom. Of course the price action and tools will play a key role in determining and confirming the bottom is in place.
For the dollar index, keep an eye on the 200 hour MA as a risk and bias defining level. If it can stay above, that level, there is room for further upside potential in the new trading week.

