This week the RBNZ released the Financial Stability Report and Governor Wheeler spoke and testified to the report. Some of the highlights included:
- Mortgage lending limits would not be relaxed
- Risk remained for resurgence of house price inflation from immigration/low mortgage rates
- NZ dollar still elevated and could drop further
- NZ dollar is above sustainable and justified levels
- Rates may need to rise again in “coming years”
- Rates are still stimulating economy
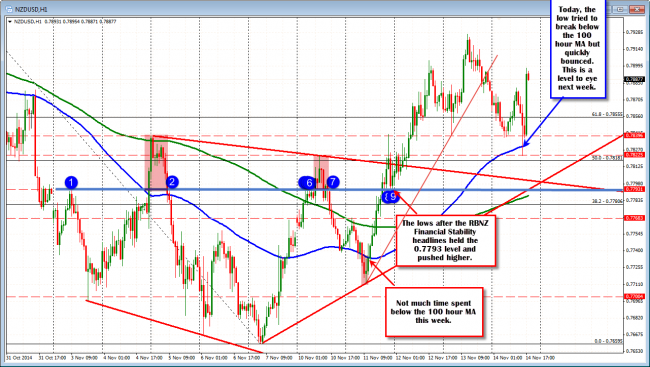
NZDUSD spent must time above 100 hour MA and based against the 0.7793 level.
The NZDUSD rallied into the report and held above the 0.7993 level (see blue horizontal line in the chart above). This line had developed as a level where market found energy (on moves higher and on moves lower on failures). The level is where the market based after the report was released – despite the repeated calls that the currency was overvalued. The market is not so scared from the comments anymore.
The other take away from the week is that there was little trading done below the 100 hour MA(blue line in the chart above) On Tuesday – before the pre-report rally – the price fell below the 100 hour MA and had 4 hourly bar closes below the level. Today, the price went below the 100 hour MA again but could not close below the level and the price snapped back. The 100 hour MA is at the 0.7832 level currently and staying above keeps the bulls in charge today and going forward into next week.
Looking at the daily chart, the pair remained above the September low at 0.7707 this week (the low came in at 0.7711). The low for November took out that September low on the way to 0.76595. This was the lowest level going back to June 2012.The inability to move below 0.7707 was a positive sign. Toward the end of the week, the market has tried to get back above the broken lower trend line on what was a bear flag. That level comes in at 07874 today. A close above will be more positive.
So the week is ending on a bullish note for the pair. Next week, the trend line from the daily chart (at 0.7874 and moving higher) and the 100 hour MA (currently at 0.7832) will be eyed as support levels (risk for longs) if the price is to continue to the bullish corrective bias to the upside.
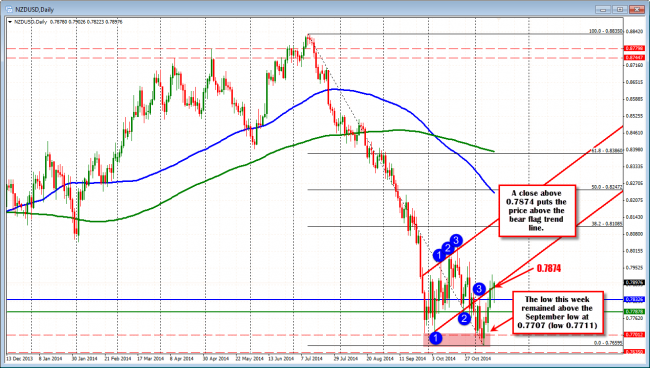
The NZDUSD on the daily chart held the low September this week and is trying to close back above the bear flag trend line.