The higher CPI data out higher than expected and this is keeping the pressure on the USDCAD. Looking at the daily chart the price has broken below the trend line today at the 1.1264 level and also below the old high going back to March 2014 (at 1.1277 and 1.1264 respectively). On the chart the next target support comes in at the 38.2% of the move up from the July low at the 1.1424 level.
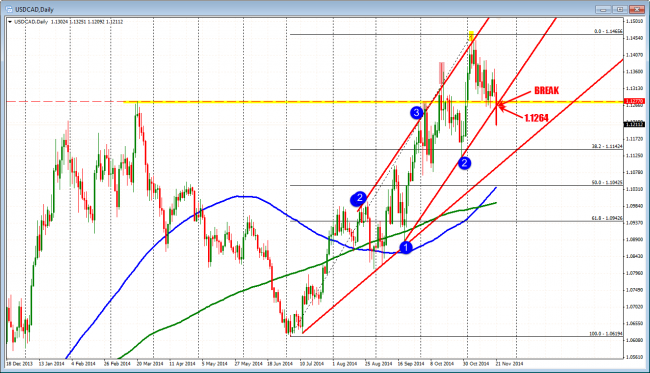
The USDCAD is below trend line support now.
Looking at the hourly chart the price tested the 200 hour MA earlier today (green line in the chart below – nice hold) and and now tumbled below the lows from last week/this week at the 1.1258-63 and the lower trend line at the 1.1221. The close intraday resistance is now at 1.1221. The stronger “Line in the Sand” resistance comes in on this chart at the 1.1258-63 (see chart below). This level also corresponds with the break level on the daily chart (at 1.1264). If the sellers/bears are to remain in control, this level should not be broken.
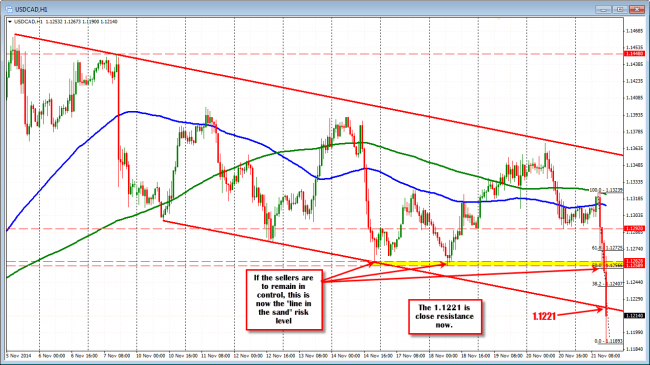
USDCAD has close resistance at 1.1221. The Line in the Sand that should not be broken is at 1.1258-62 now.