Umm … Very.
Its broken through (easily) important lows of the past nearly two years.
The first chart shows 3 years price action, and due to the scale you cant really see today’s candle that clearly, so the second chart is one year only:
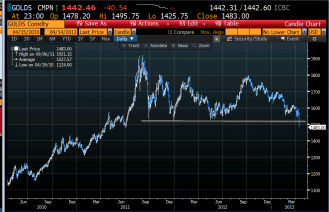
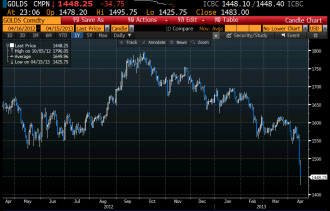
Source is Bloomberg
Its been in a downtrend for a while. Will find resistance on bounces now.