
Only this week Adam noted that this was clearly a sellers market and I noted after the last inflation report that inflation needed close watching.
Of course you could have ignored us all and paid out for some good bank analysis; Citi sees USD/CAD rising to 1.10-1.11, says BOC will emphasize downside inflation risks
Those inflation numbers show more than temporary factors given the rise since Feb. There maybe a case for inflation to drop back on the back of this very sharp rise but four months of gains suggests that the BOC may have to revise their forecasts.
Core inflation will be the one to watch though as it strips out the volatile components like energy and that may keep the BOC from turning too hawkish just yet. That won’t stop the market chattering about the numbers though and that’s going to keep USD/CAD under pressure.
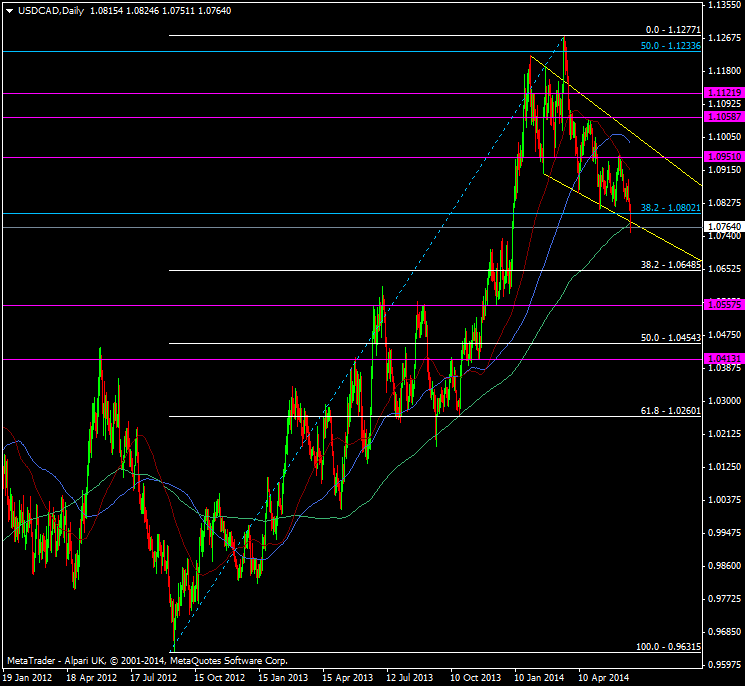
USD/CAD daily chart 20 06 2014
In the short term look for the 200 dma and that lower channel line to act as resistance.
The next support levels will come in around the cluster Dec 2013 highs at 1.0705/30. Under there the bigger level is the 38.2 fib from the Sep 2012/Mar 2014 low/hi at 1.0648.
In defense of Citi I was looking at one of their levels to enter a short against this inflation picture. We didn’t get there and owing to my reluctance to chase a market I’m not in, much to my chagrin. I may look to see how we fare on a test of the 200 dma and that channel line with a view to scaling in the break, but the trade to be on was from the 1.09’s.

