
Earlier this morning, I wrote the following post when the EURUSD was trading at the 1.2758 level (SEE: EURUSD Technical Analysis: Looking for sellers near the days midpoint). I was thinking lower.
The Initial Claims data was great. The 4 week moving average came in at the lowest level since June 2000 (yes, 2000).
There was IP/Cap Utilization and Philly Fed still to come, but at least the day was off to a good start.
There was the stock market to worry about of course, but surely there could be a bounce back as a result of the better claims data. After all the S&P yesterday, got within sniffing distance of a 10% decline from the top and the data was better.
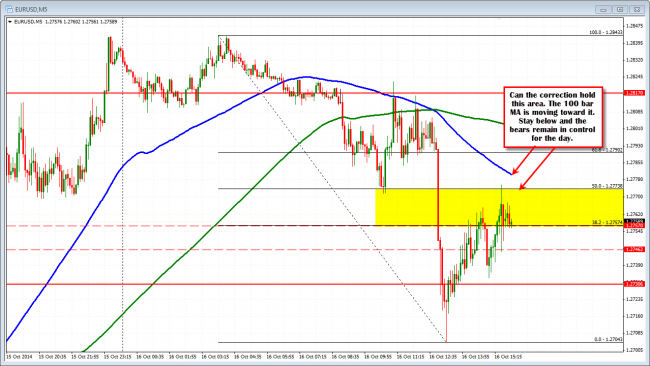
The EURUSD is testing midpoint of the days range.
From a technical perspective, the charts were showing some bearish overtones. The above chart outlined the risk levels.
I wrote in my post:
If the price is to go down, I will need to see the price head back below the 1.2746 level. From there the 100 hour MA should be tested again. Looking at the 5 minute chart, the pair just tested the midpoint of the days trading range (at 1.27738). This might be a level to lean against in trading this morning. I would not want to see a move above the high from last week at 1.2791 no matter what today. It would suggest something else is up (like stocks getting creamed and shorts covering).
So, what happened?
Industrial Production and Capacity Utilization came out better than expectations. Great.
Stocks opened and it was volatile but a bottom started to form. Great.
I thought, that the EURUSD will get creamed…not the stocks! Yippee.
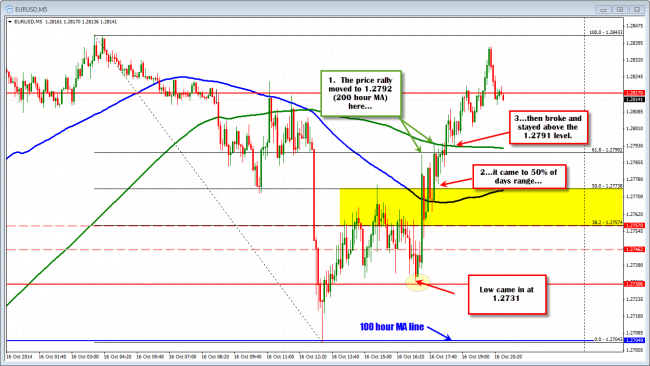
The price of the EURUSD fell as low as 1.2731 – below the 1.2746 level – and a test of the 100 hour MA seemed a certainty (see chart below)….
NOT TO BE….
The EURUSD rallied.
What about the EURUSD? What did it do?
- The price rallied back to the 1.2791 “line in the sand” that I did not want to see breached (see 1 in chart above).
- The corrections off those peaks held the 1.2757 and then the 50% level at 1.27738 (see 2),
- Finally, the price moved above the 1.2791 level (see 3).
The technical picture really started to turn around after the move below the 1.2746 level did not stay below that area. It was really over on the move above the 1.2791 “line in the sand”.
What about the fundamental picture?
- Data was better in the US
- Stocks went higher
- Dollar has fallen and the EURUSD has moved to a high of 1.2838 (so far) – nearly erasing the entire move lower.
Typically, they write the fundamental story of the day and it makes sense. For me, I have trouble ‘writing that story” but at least I can write the “technical story”. It may not have been the story I would have thought it would have been at the beginning of the day, but it makes some sense to me… Tomorrow is another day..

